|
Download Data (XLS File) |
|
||||||||
|
||||||||
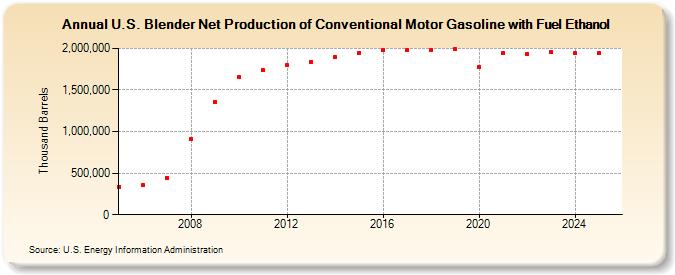
| U.S. Blender Net Production of Conventional Motor Gasoline with Fuel Ethanol (Thousand Barrels) | ||||||||
| Decade | Year-0 | Year-1 | Year-2 | Year-3 | Year-4 | Year-5 | Year-6 | Year-7 | Year-8 | Year-9 |
|---|---|---|---|---|---|---|---|---|---|---|
| 2000's | 337,744 | 356,302 | 446,467 | 907,989 | 1,357,540 | |||||
| 2010's | 1,652,466 | 1,735,637 | 1,799,131 | 1,841,686 | 1,895,508 | 1,948,026 | 1,979,406 | 1,978,117 | 1,983,773 | 1,993,881 |
| 2020's | 1,775,400 | 1,939,339 | 1,938,348 | 1,950,904 |
| - = No Data Reported; -- = Not Applicable; NA = Not Available; W = Withheld to avoid disclosure of individual company data. |
| Release Date: 8/30/2024 |
| Next Release Date: 8/29/2025 |