|
Download Data (XLS File) |
|
||||||||
|
||||||||
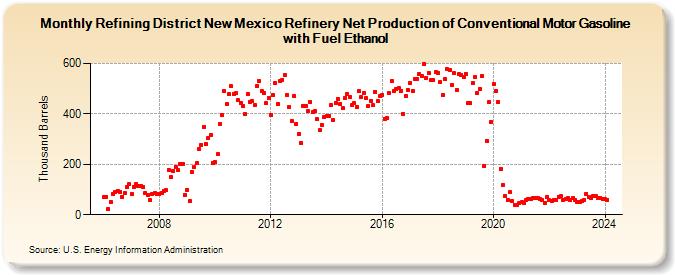
| Refining District New Mexico Refinery Net Production of Conventional Motor Gasoline with Fuel Ethanol (Thousand Barrels) | ||||||||
| Year | Jan | Feb | Mar | Apr | May | Jun | Jul | Aug | Sep | Oct | Nov | Dec |
|---|---|---|---|---|---|---|---|---|---|---|---|---|
| 2006 | 71 | 72 | 21 | 51 | 83 | 91 | 96 | 91 | 72 | 86 | 109 | 120 |
| 2007 | 82 | 110 | 122 | 114 | 114 | 110 | 86 | 79 | 57 | 84 | 86 | 84 |
| 2008 | 83 | 87 | 96 | 97 | 178 | 149 | 173 | 190 | 176 | 201 | 201 | 80 |
| 2009 | 98 | 53 | 170 | 190 | 205 | 261 | 278 | 349 | 279 | 304 | 316 | 206 |
| 2010 | 209 | 239 | 358 | 394 | 489 | 438 | 479 | 509 | 479 | 481 | 454 | 443 |
| 2011 | 431 | 399 | 477 | 449 | 450 | 435 | 510 | 531 | 490 | 482 | 443 | 463 |
| 2012 | 397 | 474 | 522 | 440 | 532 | 536 | 555 | 476 | 428 | 372 | 471 | 360 |
| 2013 | 320 | 286 | 433 | 431 | 410 | 448 | 406 | 410 | 378 | 336 | 356 | 388 |
| 2014 | 390 | 393 | 435 | 374 | 445 | 460 | 440 | 422 | 465 | 477 | 469 | 435 |
| 2015 | 442 | 428 | 489 | 466 | 482 | 462 | 431 | 452 | 435 | 488 | 452 | 470 |
| 2016 | 476 | 381 | 383 | 483 | 531 | 491 | 500 | 501 | 489 | 401 | 471 | 495 |
| 2017 | 524 | 492 | 540 | 538 | 557 | 549 | 596 | 543 | 562 | 535 | 535 | 565 |
| 2018 | 563 | 525 | 476 | 537 | 577 | 576 | 515 | 561 | 495 | 558 | 556 | 547 |
| 2019 | 560 | 443 | 443 | 522 | 545 | 481 | 498 | 550 | 195 | 293 | 446 | 367 |
| 2020 | 517 | 490 | 447 | 182 | 118 | 74 | 59 | 89 | 54 | 40 | 40 | 47 |
| 2021 | 49 | 48 | 59 | 63 | 61 | 65 | 68 | 68 | 62 | 57 | 47 | 71 |
| 2022 | 57 | 55 | 59 | 60 | 71 | 74 | 60 | 62 | 66 | 57 | 67 | 60 |
| 2023 | 52 | 50 | 54 | 58 | 84 | 70 | 66 | 76 | 73 | 68 | 68 | 64 |
| 2024 | 61 | |||||||||||
| - = No Data Reported; -- = Not Applicable; NA = Not Available; W = Withheld to avoid disclosure of individual company data. |
| Release Date: 3/29/2024 |
| Next Release Date: 4/30/2024 |