|
Download Data (XLS File) |
|
||||||||
|
||||||||
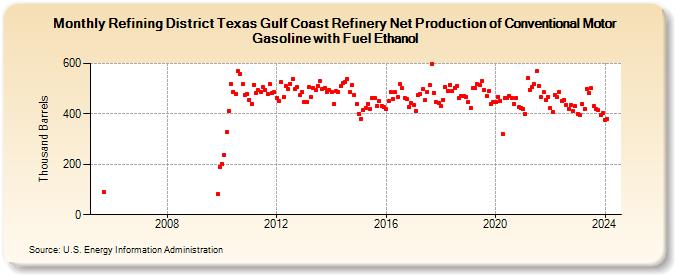
| Refining District Texas Gulf Coast Refinery Net Production of Conventional Motor Gasoline with Fuel Ethanol (Thousand Barrels) | ||||||||
| Year | Jan | Feb | Mar | Apr | May | Jun | Jul | Aug | Sep | Oct | Nov | Dec |
|---|---|---|---|---|---|---|---|---|---|---|---|---|
| 2005 | 91 | |||||||||||
| 2009 | 82 | 191 | ||||||||||
| 2010 | 203 | 236 | 327 | 412 | 518 | 488 | 480 | 569 | 559 | 517 | 474 | 480 |
| 2011 | 456 | 439 | 516 | 482 | 493 | 487 | 505 | 496 | 478 | 517 | 483 | 485 |
| 2012 | 465 | 450 | 525 | 468 | 512 | 500 | 520 | 540 | 497 | 507 | 473 | 486 |
| 2013 | 449 | 447 | 506 | 467 | 501 | 496 | 512 | 531 | 499 | 504 | 487 | 493 |
| 2014 | 485 | 440 | 490 | 487 | 509 | 521 | 527 | 539 | 486 | 514 | 475 | 439 |
| 2015 | 401 | 380 | 414 | 424 | 441 | 419 | 462 | 462 | 433 | 450 | 430 | 426 |
| 2016 | 418 | 450 | 486 | 461 | 485 | 467 | 517 | 501 | 464 | 458 | 426 | 444 |
| 2017 | 436 | 410 | 473 | 479 | 497 | 454 | 488 | 515 | 598 | 484 | 448 | 443 |
| 2018 | 430 | 457 | 507 | 492 | 516 | 490 | 504 | 511 | 465 | 472 | 471 | 469 |
| 2019 | 448 | 424 | 502 | 502 | 519 | 513 | 530 | 496 | 471 | 489 | 441 | 446 |
| 2020 | 446 | 469 | 453 | 320 | 463 | 465 | 471 | 463 | 441 | 465 | 426 | 423 |
| 2021 | 419 | 400 | 542 | 496 | 506 | 517 | 570 | 512 | 467 | 485 | 456 | 469 |
| 2022 | 423 | 407 | 475 | 467 | 487 | 451 | 454 | 436 | 421 | 436 | 410 | 430 |
| 2023 | 401 | 395 | 440 | 420 | 500 | 483 | 501 | 430 | 420 | 415 | 394 | 403 |
| 2024 | 377 | |||||||||||
| - = No Data Reported; -- = Not Applicable; NA = Not Available; W = Withheld to avoid disclosure of individual company data. |
| Release Date: 3/29/2024 |
| Next Release Date: 4/30/2024 |