|
Download Data (XLS File) |
|
||||||||
|
||||||||
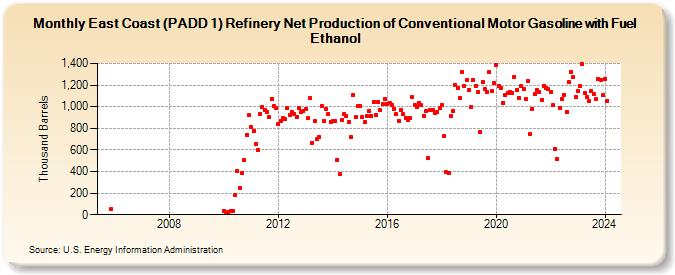
| East Coast (PADD 1) Refinery Net Production of Conventional Motor Gasoline with Fuel Ethanol (Thousand Barrels) | ||||||||
| Year | Jan | Feb | Mar | Apr | May | Jun | Jul | Aug | Sep | Oct | Nov | Dec |
|---|---|---|---|---|---|---|---|---|---|---|---|---|
| 2005 | 50 | |||||||||||
| 2010 | 31 | 19 | 26 | 39 | 37 | 182 | 402 | 244 | 388 | 505 | 741 | 919 |
| 2011 | 814 | 777 | 656 | 595 | 932 | 1,001 | 971 | 953 | 903 | 1,070 | 1,005 | 986 |
| 2012 | 838 | 872 | 891 | 887 | 987 | 921 | 952 | 934 | 901 | 985 | 955 | 961 |
| 2013 | 976 | 892 | 1,077 | 668 | 865 | 698 | 719 | 1,010 | 869 | 977 | 932 | 862 |
| 2014 | 870 | 866 | 511 | 373 | 879 | 932 | 918 | 859 | 715 | 1,108 | 903 | 1,005 |
| 2015 | 1,007 | 902 | 860 | 910 | 960 | 910 | 1,047 | 921 | 1,045 | 966 | 1,026 | 1,068 |
| 2016 | 1,026 | 1,030 | 1,019 | 982 | 933 | 870 | 966 | 928 | 895 | 873 | 893 | 1,091 |
| 2017 | 1,018 | 998 | 1,033 | 1,012 | 917 | 956 | 525 | 970 | 970 | 940 | 954 | 989 |
| 2018 | 1,019 | 728 | 393 | 386 | 911 | 961 | 1,199 | 1,177 | 1,079 | 1,320 | 1,196 | 1,247 |
| 2019 | 1,158 | 1,001 | 1,245 | 1,194 | 1,133 | 770 | 1,228 | 1,165 | 1,137 | 1,322 | 1,145 | 1,220 |
| 2020 | 1,386 | 1,190 | 1,174 | 1,037 | 1,105 | 1,125 | 1,140 | 1,131 | 1,272 | 1,155 | 1,084 | 1,189 |
| 2021 | 1,160 | 1,069 | 1,234 | 751 | 982 | 1,116 | 1,153 | 1,135 | 1,064 | 1,196 | 1,171 | 1,161 |
| 2022 | 1,137 | 1,014 | 612 | 519 | 989 | 1,073 | 1,106 | 951 | 1,227 | 1,319 | 1,272 | 1,086 |
| 2023 | 1,144 | 1,192 | 1,395 | 1,131 | 1,089 | 1,051 | 1,143 | 1,121 | 1,067 | 1,255 | 1,251 | 1,104 |
| 2024 | 1,257 | |||||||||||
| - = No Data Reported; -- = Not Applicable; NA = Not Available; W = Withheld to avoid disclosure of individual company data. |
| Release Date: 3/29/2024 |
| Next Release Date: 4/30/2024 |