|
Download Data (XLS File) |
|
||||||||
|
||||||||
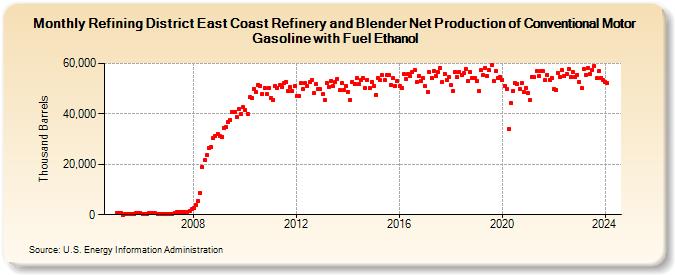
| Refining District East Coast Refinery and Blender Net Production of Conventional Motor Gasoline with Fuel Ethanol (Thousand Barrels) | ||||||||
| Year | Jan | Feb | Mar | Apr | May | Jun | Jul | Aug | Sep | Oct | Nov | Dec |
|---|---|---|---|---|---|---|---|---|---|---|---|---|
| 2005 | 689 | 622 | 752 | 84 | 86 | 135 | 192 | 200 | 181 | 664 | 641 | 622 |
| 2006 | 439 | 461 | 472 | 602 | 738 | 557 | 503 | 438 | 356 | 365 | 355 | 368 |
| 2007 | 333 | 317 | 351 | 805 | 962 | 972 | 1,015 | 1,057 | 968 | 1,198 | 1,528 | 2,214 |
| 2008 | 2,690 | 4,016 | 5,503 | 8,687 | 18,759 | 21,736 | 23,538 | 26,506 | 26,865 | 30,329 | 31,146 | 32,140 |
| 2009 | 31,191 | 30,942 | 34,386 | 34,732 | 36,975 | 37,700 | 40,682 | 40,917 | 38,899 | 41,810 | 39,973 | 42,645 |
| 2010 | 41,458 | 40,068 | 46,540 | 46,497 | 50,008 | 48,842 | 51,527 | 51,067 | 47,977 | 50,416 | 47,937 | 50,290 |
| 2011 | 46,271 | 45,586 | 51,106 | 50,206 | 51,338 | 50,738 | 52,111 | 52,791 | 48,989 | 50,643 | 48,896 | 50,921 |
| 2012 | 47,260 | 47,206 | 52,144 | 49,729 | 52,068 | 50,952 | 52,483 | 53,319 | 48,278 | 51,735 | 49,686 | 49,753 |
| 2013 | 47,725 | 45,485 | 52,339 | 50,794 | 53,157 | 50,961 | 52,578 | 53,996 | 49,300 | 52,274 | 49,586 | 50,895 |
| 2014 | 48,697 | 45,582 | 52,750 | 51,820 | 54,394 | 51,691 | 53,514 | 54,156 | 50,140 | 53,638 | 50,226 | 52,636 |
| 2015 | 51,102 | 47,602 | 54,428 | 53,467 | 55,257 | 53,306 | 55,314 | 55,484 | 51,414 | 54,042 | 51,004 | 52,978 |
| 2016 | 50,962 | 50,285 | 55,645 | 53,863 | 55,832 | 54,932 | 56,597 | 57,291 | 52,626 | 55,072 | 52,985 | 54,109 |
| 2017 | 50,870 | 48,708 | 56,538 | 54,391 | 57,111 | 55,220 | 56,537 | 58,109 | 52,689 | 55,973 | 53,403 | 54,482 |
| 2018 | 51,288 | 49,141 | 56,816 | 54,544 | 56,704 | 55,314 | 56,112 | 57,893 | 53,062 | 56,494 | 54,139 | 54,055 |
| 2019 | 53,082 | 49,167 | 57,259 | 55,523 | 58,323 | 55,122 | 57,240 | 59,316 | 52,858 | 56,824 | 54,211 | 54,574 |
| 2020 | 53,460 | 51,215 | 49,724 | 33,949 | 44,232 | 49,208 | 52,058 | 51,902 | 49,897 | 52,318 | 48,764 | 50,376 |
| 2021 | 48,469 | 45,342 | 54,557 | 54,521 | 56,944 | 54,977 | 56,927 | 56,915 | 53,428 | 55,609 | 53,583 | 54,316 |
| 2022 | 49,813 | 49,635 | 56,336 | 54,503 | 57,573 | 54,917 | 55,814 | 57,738 | 54,611 | 56,430 | 54,482 | 55,543 |
| 2023 | 52,610 | 50,129 | 57,766 | 55,531 | 58,404 | 55,801 | 57,525 | 58,866 | 54,118 | 56,973 | 54,400 | 53,440 |
| 2024 | 52,780 | |||||||||||
| - = No Data Reported; -- = Not Applicable; NA = Not Available; W = Withheld to avoid disclosure of individual company data. |
| Release Date: 3/29/2024 |
| Next Release Date: 4/30/2024 |