|
Download Data (XLS File) |
|
||||||||
|
||||||||
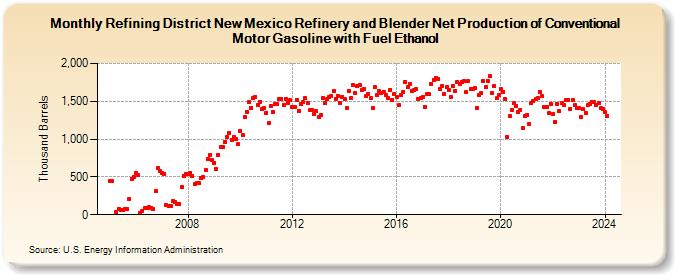
| Refining District New Mexico Refinery and Blender Net Production of Conventional Motor Gasoline with Fuel Ethanol (Thousand Barrels) | ||||||||
| Year | Jan | Feb | Mar | Apr | May | Jun | Jul | Aug | Sep | Oct | Nov | Dec |
|---|---|---|---|---|---|---|---|---|---|---|---|---|
| 2005 | 447 | 445 | 38 | 79 | 66 | 67 | 71 | 70 | 212 | 474 | 500 | |
| 2006 | 553 | 519 | 22 | 51 | 83 | 91 | 96 | 91 | 72 | 310 | 614 | 577 |
| 2007 | 558 | 541 | 124 | 115 | 114 | 176 | 163 | 147 | 137 | 364 | 516 | 544 |
| 2008 | 533 | 556 | 508 | 401 | 414 | 413 | 483 | 498 | 589 | 735 | 794 | 722 |
| 2009 | 688 | 601 | 791 | 895 | 889 | 960 | 1,031 | 1,083 | 990 | 1,030 | 1,004 | 933 |
| 2010 | 1,105 | 1,053 | 1,298 | 1,364 | 1,486 | 1,414 | 1,544 | 1,558 | 1,452 | 1,490 | 1,395 | 1,414 |
| 2011 | 1,351 | 1,213 | 1,439 | 1,362 | 1,460 | 1,458 | 1,527 | 1,531 | 1,452 | 1,535 | 1,479 | 1,513 |
| 2012 | 1,420 | 1,424 | 1,521 | 1,378 | 1,469 | 1,486 | 1,537 | 1,478 | 1,381 | 1,386 | 1,330 | 1,368 |
| 2013 | 1,291 | 1,314 | 1,542 | 1,471 | 1,530 | 1,554 | 1,573 | 1,634 | 1,530 | 1,570 | 1,476 | 1,561 |
| 2014 | 1,530 | 1,414 | 1,637 | 1,545 | 1,712 | 1,615 | 1,701 | 1,716 | 1,647 | 1,660 | 1,575 | 1,597 |
| 2015 | 1,546 | 1,417 | 1,684 | 1,577 | 1,636 | 1,609 | 1,621 | 1,579 | 1,549 | 1,653 | 1,515 | 1,598 |
| 2016 | 1,551 | 1,446 | 1,583 | 1,628 | 1,758 | 1,683 | 1,725 | 1,642 | 1,645 | 1,658 | 1,536 | 1,543 |
| 2017 | 1,563 | 1,428 | 1,591 | 1,594 | 1,732 | 1,788 | 1,807 | 1,795 | 1,657 | 1,701 | 1,602 | 1,684 |
| 2018 | 1,643 | 1,562 | 1,703 | 1,631 | 1,751 | 1,730 | 1,756 | 1,766 | 1,618 | 1,767 | 1,669 | 1,668 |
| 2019 | 1,674 | 1,412 | 1,584 | 1,611 | 1,765 | 1,685 | 1,774 | 1,830 | 1,612 | 1,707 | 1,537 | 1,588 |
| 2020 | 1,657 | 1,625 | 1,525 | 1,022 | 1,300 | 1,384 | 1,472 | 1,444 | 1,359 | 1,388 | 1,149 | 1,299 |
| 2021 | 1,322 | 1,197 | 1,481 | 1,499 | 1,526 | 1,539 | 1,620 | 1,564 | 1,420 | 1,429 | 1,343 | 1,469 |
| 2022 | 1,331 | 1,232 | 1,468 | 1,365 | 1,472 | 1,453 | 1,513 | 1,518 | 1,404 | 1,516 | 1,448 | 1,409 |
| 2023 | 1,405 | 1,293 | 1,393 | 1,350 | 1,447 | 1,469 | 1,490 | 1,485 | 1,448 | 1,476 | 1,408 | 1,400 |
| 2024 | 1,354 | 1,305 | ||||||||||
| - = No Data Reported; -- = Not Applicable; NA = Not Available; W = Withheld to avoid disclosure of individual company data. |
| Release Date: 4/30/2024 |
| Next Release Date: 5/31/2024 |