|
Download Data (XLS File) |
|
||||||||
|
||||||||
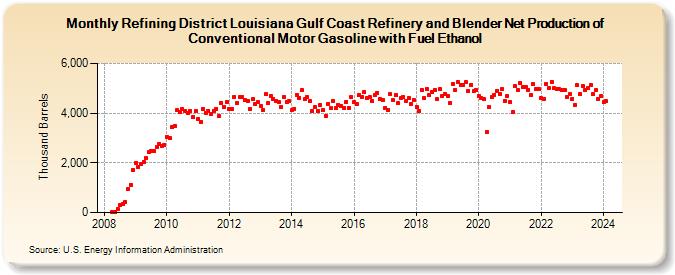
| Refining District Louisiana Gulf Coast Refinery and Blender Net Production of Conventional Motor Gasoline with Fuel Ethanol (Thousand Barrels) | ||||||||
| Year | Jan | Feb | Mar | Apr | May | Jun | Jul | Aug | Sep | Oct | Nov | Dec |
|---|---|---|---|---|---|---|---|---|---|---|---|---|
| 2008 | 9 | 14 | 136 | 292 | 349 | 417 | 948 | 1,127 | 1,725 | |||
| 2009 | 1,987 | 1,844 | 1,958 | 2,044 | 2,185 | 2,431 | 2,479 | 2,477 | 2,631 | 2,773 | 2,691 | 2,726 |
| 2010 | 3,058 | 2,987 | 3,430 | 3,498 | 4,110 | 4,040 | 4,151 | 4,093 | 4,013 | 4,080 | 3,849 | 4,073 |
| 2011 | 3,775 | 3,644 | 4,165 | 4,025 | 4,104 | 3,983 | 4,100 | 4,183 | 3,877 | 4,412 | 4,242 | 4,450 |
| 2012 | 4,162 | 4,159 | 4,658 | 4,408 | 4,638 | 4,644 | 4,524 | 4,504 | 4,159 | 4,555 | 4,362 | 4,447 |
| 2013 | 4,298 | 4,134 | 4,754 | 4,403 | 4,695 | 4,571 | 4,497 | 4,457 | 4,250 | 4,653 | 4,455 | 4,474 |
| 2014 | 4,116 | 4,179 | 4,742 | 4,620 | 4,926 | 4,559 | 4,644 | 4,473 | 4,078 | 4,250 | 4,085 | 4,336 |
| 2015 | 4,115 | 3,894 | 4,387 | 4,191 | 4,482 | 4,202 | 4,343 | 4,299 | 4,201 | 4,464 | 4,214 | 4,642 |
| 2016 | 4,454 | 4,351 | 4,721 | 4,647 | 4,841 | 4,593 | 4,657 | 4,498 | 4,730 | 4,825 | 4,555 | 4,511 |
| 2017 | 4,221 | 4,138 | 4,757 | 4,519 | 4,731 | 4,404 | 4,593 | 4,655 | 4,483 | 4,608 | 4,382 | 4,528 |
| 2018 | 4,260 | 4,090 | 4,950 | 4,617 | 4,965 | 4,726 | 4,851 | 4,938 | 4,551 | 4,958 | 4,696 | 4,781 |
| 2019 | 4,678 | 4,416 | 5,175 | 4,935 | 5,250 | 5,116 | 5,122 | 5,236 | 4,904 | 5,152 | 4,886 | 4,933 |
| 2020 | 4,688 | 4,601 | 4,551 | 3,223 | 4,241 | 4,651 | 4,740 | 4,899 | 4,753 | 4,978 | 4,500 | 4,690 |
| 2021 | 4,451 | 4,045 | 5,079 | 4,917 | 5,223 | 5,068 | 5,060 | 4,947 | 4,738 | 5,162 | 4,986 | 4,968 |
| 2022 | 4,607 | 4,576 | 5,167 | 5,009 | 5,265 | 5,002 | 4,988 | 4,970 | 4,923 | 4,924 | 4,651 | 4,760 |
| 2023 | 4,568 | 4,349 | 5,119 | 4,760 | 5,081 | 4,926 | 4,998 | 5,121 | 4,759 | 4,923 | 4,590 | 4,684 |
| 2024 | 4,446 | |||||||||||
| - = No Data Reported; -- = Not Applicable; NA = Not Available; W = Withheld to avoid disclosure of individual company data. |
| Release Date: 3/29/2024 |
| Next Release Date: 4/30/2024 |