|
Download Data (XLS File) |
|
||||||||
|
||||||||
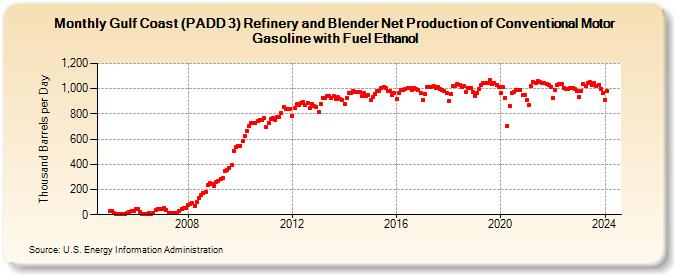
| Gulf Coast (PADD 3) Refinery and Blender Net Production of Conventional Motor Gasoline with Fuel Ethanol (Thousand Barrels per Day) | ||||||||
| Year | Jan | Feb | Mar | Apr | May | Jun | Jul | Aug | Sep | Oct | Nov | Dec |
|---|---|---|---|---|---|---|---|---|---|---|---|---|
| 2005 | 31 | 31 | 17 | 5 | 7 | 6 | 6 | 7 | 14 | 25 | 33 | 31 |
| 2006 | 42 | 42 | 24 | 5 | 6 | 6 | 14 | 7 | 16 | 37 | 49 | 48 |
| 2007 | 49 | 52 | 36 | 12 | 12 | 14 | 16 | 17 | 27 | 47 | 56 | 57 |
| 2008 | 80 | 86 | 91 | 70 | 99 | 134 | 160 | 173 | 183 | 236 | 249 | 243 |
| 2009 | 229 | 261 | 269 | 284 | 292 | 344 | 355 | 371 | 391 | 509 | 534 | 546 |
| 2010 | 548 | 588 | 625 | 668 | 701 | 727 | 729 | 726 | 740 | 750 | 749 | 766 |
| 2011 | 695 | 730 | 761 | 769 | 752 | 777 | 776 | 804 | 855 | 838 | 836 | 842 |
| 2012 | 784 | 843 | 877 | 872 | 884 | 894 | 869 | 884 | 845 | 875 | 866 | 856 |
| 2013 | 813 | 878 | 929 | 924 | 940 | 945 | 923 | 939 | 918 | 932 | 919 | 912 |
| 2014 | 877 | 928 | 968 | 969 | 978 | 971 | 972 | 973 | 939 | 963 | 941 | 946 |
| 2015 | 909 | 936 | 958 | 980 | 982 | 1,005 | 1,010 | 1,004 | 979 | 979 | 952 | 967 |
| 2016 | 917 | 965 | 990 | 992 | 998 | 1,009 | 1,007 | 991 | 1,005 | 994 | 987 | 963 |
| 2017 | 907 | 961 | 1,010 | 1,010 | 1,014 | 1,018 | 1,006 | 1,011 | 998 | 993 | 979 | 965 |
| 2018 | 900 | 954 | 1,018 | 1,020 | 1,038 | 1,029 | 1,010 | 1,023 | 975 | 1,006 | 1,006 | 976 |
| 2019 | 945 | 962 | 995 | 1,028 | 1,047 | 1,043 | 1,042 | 1,071 | 1,035 | 1,048 | 1,027 | 1,010 |
| 2020 | 968 | 1,010 | 930 | 704 | 865 | 962 | 970 | 992 | 987 | 990 | 946 | 951 |
| 2021 | 912 | 871 | 1,018 | 1,052 | 1,048 | 1,063 | 1,050 | 1,046 | 1,044 | 1,034 | 1,032 | 1,015 |
| 2022 | 925 | 987 | 1,031 | 1,038 | 1,039 | 1,008 | 994 | 999 | 1,009 | 1,009 | 998 | 978 |
| 2023 | 935 | 984 | 1,036 | 1,025 | 1,049 | 1,051 | 1,030 | 1,045 | 1,024 | 1,027 | 1,000 | 966 |
| 2024 | 912 | |||||||||||
| - = No Data Reported; -- = Not Applicable; NA = Not Available; W = Withheld to avoid disclosure of individual company data. |
| Release Date: 3/29/2024 |
| Next Release Date: 4/30/2024 |