|
Download Data (XLS File) |
|
||||||||
|
||||||||
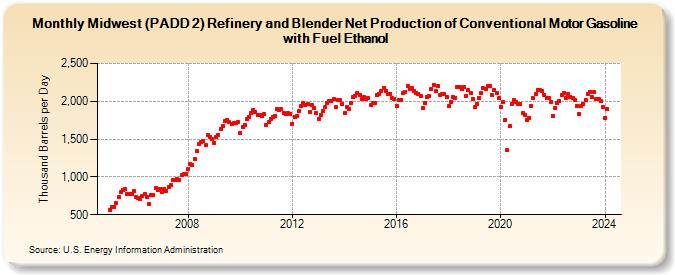
| Midwest (PADD 2) Refinery and Blender Net Production of Conventional Motor Gasoline with Fuel Ethanol (Thousand Barrels per Day) | ||||||||
| Year | Jan | Feb | Mar | Apr | May | Jun | Jul | Aug | Sep | Oct | Nov | Dec |
|---|---|---|---|---|---|---|---|---|---|---|---|---|
| 2005 | 567 | 596 | 606 | 656 | 737 | 797 | 831 | 834 | 770 | 768 | 777 | 808 |
| 2006 | 728 | 727 | 703 | 750 | 776 | 730 | 646 | 764 | 758 | 853 | 826 | 846 |
| 2007 | 807 | 839 | 819 | 862 | 899 | 958 | 953 | 975 | 962 | 1,021 | 1,036 | 1,037 |
| 2008 | 1,100 | 1,170 | 1,156 | 1,235 | 1,337 | 1,441 | 1,463 | 1,477 | 1,423 | 1,552 | 1,531 | 1,495 |
| 2009 | 1,447 | 1,524 | 1,553 | 1,634 | 1,671 | 1,742 | 1,747 | 1,720 | 1,705 | 1,712 | 1,708 | 1,725 |
| 2010 | 1,584 | 1,665 | 1,690 | 1,760 | 1,798 | 1,844 | 1,891 | 1,861 | 1,820 | 1,818 | 1,804 | 1,828 |
| 2011 | 1,693 | 1,731 | 1,769 | 1,786 | 1,806 | 1,897 | 1,886 | 1,894 | 1,843 | 1,828 | 1,841 | 1,833 |
| 2012 | 1,703 | 1,798 | 1,800 | 1,873 | 1,938 | 1,971 | 1,947 | 1,962 | 1,857 | 1,952 | 1,909 | 1,850 |
| 2013 | 1,764 | 1,817 | 1,870 | 1,921 | 1,977 | 2,001 | 2,005 | 2,024 | 1,920 | 2,022 | 2,012 | 1,968 |
| 2014 | 1,840 | 1,920 | 1,893 | 1,982 | 2,052 | 2,070 | 2,113 | 2,083 | 2,026 | 2,051 | 2,030 | 2,043 |
| 2015 | 1,947 | 1,983 | 1,981 | 2,080 | 2,103 | 2,139 | 2,170 | 2,130 | 2,099 | 2,103 | 2,039 | 2,029 |
| 2016 | 1,942 | 2,014 | 2,018 | 2,105 | 2,123 | 2,198 | 2,161 | 2,175 | 2,137 | 2,113 | 2,102 | 2,075 |
| 2017 | 1,906 | 1,971 | 2,060 | 2,068 | 2,158 | 2,218 | 2,136 | 2,207 | 2,087 | 2,095 | 2,097 | 2,058 |
| 2018 | 1,932 | 1,992 | 2,057 | 2,048 | 2,191 | 2,190 | 2,161 | 2,191 | 2,072 | 2,148 | 2,104 | 2,032 |
| 2019 | 1,919 | 1,962 | 2,043 | 2,105 | 2,170 | 2,162 | 2,197 | 2,197 | 2,079 | 2,151 | 2,109 | 2,037 |
| 2020 | 1,930 | 1,987 | 1,757 | 1,350 | 1,668 | 1,967 | 2,020 | 1,990 | 1,968 | 1,966 | 1,839 | 1,825 |
| 2021 | 1,754 | 1,782 | 1,944 | 2,042 | 2,091 | 2,152 | 2,145 | 2,140 | 2,085 | 2,042 | 2,038 | 1,997 |
| 2022 | 1,803 | 1,915 | 1,974 | 2,005 | 2,089 | 2,110 | 2,050 | 2,095 | 2,059 | 2,038 | 2,021 | 1,943 |
| 2023 | 1,830 | 1,942 | 1,970 | 2,019 | 2,101 | 2,127 | 2,055 | 2,120 | 2,026 | 2,034 | 2,008 | 1,929 |
| 2024 | 1,784 | |||||||||||
| - = No Data Reported; -- = Not Applicable; NA = Not Available; W = Withheld to avoid disclosure of individual company data. |
| Release Date: 3/29/2024 |
| Next Release Date: 4/30/2024 |