|
Download Data (XLS File) |
|
||||||||
|
||||||||
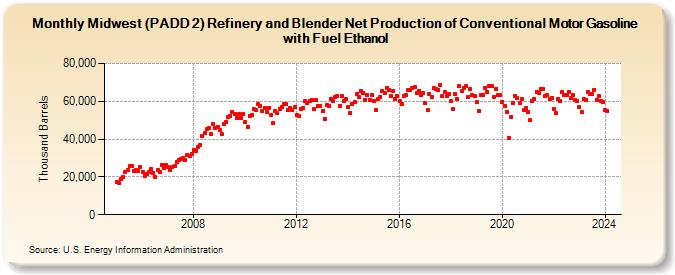
| Midwest (PADD 2) Refinery and Blender Net Production of Conventional Motor Gasoline with Fuel Ethanol (Thousand Barrels) | ||||||||
| Year | Jan | Feb | Mar | Apr | May | Jun | Jul | Aug | Sep | Oct | Nov | Dec |
|---|---|---|---|---|---|---|---|---|---|---|---|---|
| 2005 | 17,565 | 16,696 | 18,792 | 19,688 | 22,851 | 23,915 | 25,748 | 25,847 | 23,112 | 23,794 | 23,302 | 25,035 |
| 2006 | 22,570 | 20,348 | 21,795 | 22,508 | 24,057 | 21,906 | 20,020 | 23,686 | 22,745 | 26,458 | 24,790 | 26,226 |
| 2007 | 25,016 | 23,484 | 25,381 | 25,868 | 27,862 | 28,736 | 29,539 | 30,224 | 28,865 | 31,652 | 31,068 | 32,154 |
| 2008 | 34,092 | 33,941 | 35,850 | 37,061 | 41,449 | 43,232 | 45,355 | 45,784 | 42,699 | 48,113 | 45,924 | 46,353 |
| 2009 | 44,847 | 42,658 | 48,137 | 49,008 | 51,798 | 52,274 | 54,168 | 53,317 | 51,135 | 53,067 | 51,236 | 53,468 |
| 2010 | 49,115 | 46,613 | 52,401 | 52,798 | 55,723 | 55,325 | 58,609 | 57,682 | 54,612 | 56,358 | 54,120 | 56,678 |
| 2011 | 52,488 | 48,480 | 54,836 | 53,568 | 55,991 | 56,922 | 58,479 | 58,722 | 55,283 | 56,666 | 55,227 | 56,823 |
| 2012 | 52,801 | 52,131 | 55,802 | 56,196 | 60,087 | 59,128 | 60,368 | 60,811 | 55,721 | 60,514 | 57,279 | 57,343 |
| 2013 | 54,683 | 50,889 | 57,958 | 57,619 | 61,280 | 60,020 | 62,142 | 62,735 | 57,609 | 62,681 | 60,372 | 61,022 |
| 2014 | 57,045 | 53,749 | 58,693 | 59,446 | 63,607 | 62,092 | 65,507 | 64,563 | 60,773 | 63,583 | 60,905 | 63,329 |
| 2015 | 60,348 | 55,514 | 61,403 | 62,414 | 65,203 | 64,170 | 67,261 | 66,036 | 62,980 | 65,200 | 61,180 | 62,888 |
| 2016 | 60,202 | 58,396 | 62,555 | 63,156 | 65,799 | 65,933 | 66,981 | 67,413 | 64,122 | 65,513 | 63,073 | 64,316 |
| 2017 | 59,071 | 55,183 | 63,871 | 62,025 | 66,889 | 66,530 | 66,222 | 68,413 | 62,616 | 64,931 | 62,903 | 63,802 |
| 2018 | 59,906 | 55,763 | 63,755 | 61,438 | 67,931 | 65,693 | 67,005 | 67,936 | 62,153 | 66,595 | 63,124 | 62,986 |
| 2019 | 59,477 | 54,926 | 63,332 | 63,150 | 67,284 | 64,863 | 68,113 | 68,118 | 62,382 | 66,693 | 63,277 | 63,160 |
| 2020 | 59,825 | 57,627 | 54,480 | 40,509 | 51,698 | 59,014 | 62,635 | 61,684 | 59,027 | 60,953 | 55,175 | 56,575 |
| 2021 | 54,360 | 49,889 | 60,268 | 61,269 | 64,831 | 64,547 | 66,500 | 66,344 | 62,560 | 63,302 | 61,128 | 61,911 |
| 2022 | 55,908 | 53,620 | 61,186 | 60,150 | 64,765 | 63,288 | 63,539 | 64,931 | 61,765 | 63,167 | 60,624 | 60,239 |
| 2023 | 56,730 | 54,370 | 61,085 | 60,560 | 65,137 | 63,814 | 63,699 | 65,718 | 60,767 | 63,056 | 60,239 | 59,807 |
| 2024 | 55,298 | |||||||||||
| - = No Data Reported; -- = Not Applicable; NA = Not Available; W = Withheld to avoid disclosure of individual company data. |
| Release Date: 3/29/2024 |
| Next Release Date: 4/30/2024 |