|
Download Data (XLS File) |
|
||||||||
|
||||||||
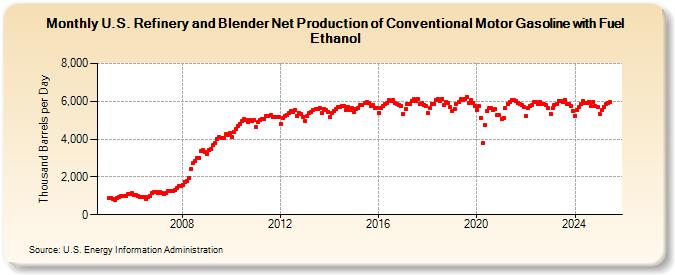
| U.S. Refinery and Blender Net Production of Conventional Motor Gasoline with Fuel Ethanol (Thousand Barrels per Day) | ||||||||
| Year | Jan | Feb | Mar | Apr | May | Jun | Jul | Aug | Sep | Oct | Nov | Dec |
|---|---|---|---|---|---|---|---|---|---|---|---|---|
| 2005 | 858 | 873 | 838 | 798 | 881 | 960 | 1,015 | 1,009 | 981 | 1,072 | 1,106 | 1,132 |
| 2006 | 1,046 | 1,048 | 979 | 944 | 957 | 914 | 824 | 944 | 975 | 1,173 | 1,206 | 1,208 |
| 2007 | 1,159 | 1,202 | 1,148 | 1,106 | 1,164 | 1,234 | 1,238 | 1,267 | 1,289 | 1,432 | 1,495 | 1,518 |
| 2008 | 1,594 | 1,746 | 1,771 | 1,959 | 2,441 | 2,712 | 2,826 | 2,975 | 3,015 | 3,356 | 3,411 | 3,321 |
| 2009 | 3,212 | 3,432 | 3,491 | 3,670 | 3,770 | 3,989 | 4,087 | 4,073 | 4,052 | 4,256 | 4,221 | 4,329 |
| 2010 | 4,113 | 4,358 | 4,515 | 4,696 | 4,824 | 4,939 | 5,069 | 5,009 | 4,926 | 5,002 | 4,945 | 5,019 |
| 2011 | 4,651 | 4,894 | 5,014 | 5,088 | 5,052 | 5,248 | 5,220 | 5,296 | 5,189 | 5,159 | 5,162 | 5,177 |
| 2012 | 4,801 | 5,128 | 5,228 | 5,270 | 5,396 | 5,498 | 5,436 | 5,523 | 5,211 | 5,403 | 5,324 | 5,180 |
| 2013 | 4,965 | 5,198 | 5,385 | 5,437 | 5,542 | 5,568 | 5,584 | 5,664 | 5,390 | 5,604 | 5,516 | 5,440 |
| 2014 | 5,165 | 5,370 | 5,483 | 5,612 | 5,718 | 5,697 | 5,751 | 5,756 | 5,553 | 5,703 | 5,562 | 5,622 |
| 2015 | 5,415 | 5,567 | 5,656 | 5,802 | 5,815 | 5,903 | 5,962 | 5,887 | 5,757 | 5,826 | 5,639 | 5,656 |
| 2016 | 5,406 | 5,660 | 5,765 | 5,859 | 5,907 | 6,064 | 6,017 | 6,051 | 5,896 | 5,866 | 5,823 | 5,752 |
| 2017 | 5,336 | 5,597 | 5,861 | 5,875 | 6,009 | 6,105 | 5,995 | 6,137 | 5,833 | 5,887 | 5,820 | 5,742 |
| 2018 | 5,395 | 5,633 | 5,868 | 5,844 | 6,071 | 6,098 | 6,027 | 6,138 | 5,807 | 5,984 | 5,894 | 5,704 |
| 2019 | 5,504 | 5,604 | 5,847 | 5,971 | 6,098 | 6,065 | 6,144 | 6,252 | 5,891 | 6,043 | 5,909 | 5,771 |
| 2020 | 5,557 | 5,733 | 5,129 | 3,791 | 4,734 | 5,483 | 5,636 | 5,629 | 5,551 | 5,579 | 5,264 | 5,250 |
| 2021 | 5,063 | 5,141 | 5,658 | 5,879 | 5,978 | 6,080 | 6,086 | 6,025 | 5,893 | 5,848 | 5,806 | 5,700 |
| 2022 | 5,206 | 5,623 | 5,768 | 5,814 | 5,965 | 5,946 | 5,841 | 5,977 | 5,871 | 5,849 | 5,792 | 5,626 |
| 2023 | 5,338 | 5,628 | 5,812 | 5,853 | 6,028 | 6,049 | 5,965 | 6,088 | 5,835 | 5,871 | 5,751 | 5,486 |
| 2024 | 5,222 | |||||||||||
| - = No Data Reported; -- = Not Applicable; NA = Not Available; W = Withheld to avoid disclosure of individual company data. |
| Release Date: 3/29/2024 |
| Next Release Date: 4/30/2024 |