|
Download Data (XLS File) |
|
||||||||
|
||||||||
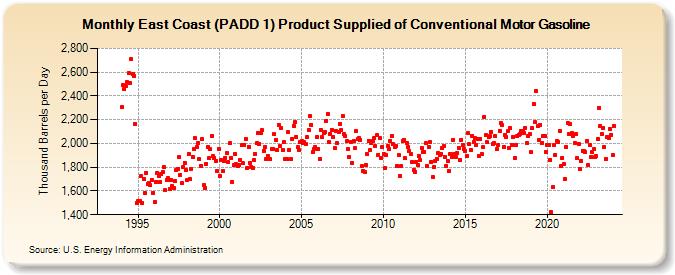
| East Coast (PADD 1) Product Supplied of Conventional Motor Gasoline (Thousand Barrels per Day) | ||||||||
| Year | Jan | Feb | Mar | Apr | May | Jun | Jul | Aug | Sep | Oct | Nov | Dec |
|---|---|---|---|---|---|---|---|---|---|---|---|---|
| 1993 | NA | NA | NA | NA | NA | NA | NA | NA | NA | NA | NA | NA |
| 1994 | 2,305 | 2,491 | 2,456 | 2,485 | 2,517 | 2,593 | 2,509 | 2,710 | 2,582 | 2,570 | 2,164 | 1,500 |
| 1995 | 1,513 | 1,514 | 1,725 | 1,502 | 1,697 | 1,581 | 1,755 | 1,661 | 1,671 | 1,646 | 1,695 | 1,585 |
| 1996 | 1,508 | 1,678 | 1,752 | 1,722 | 1,675 | 1,745 | 1,758 | 1,798 | 1,607 | 1,695 | 1,705 | 1,618 |
| 1997 | 1,691 | 1,642 | 1,623 | 1,680 | 1,774 | 1,787 | 1,885 | 1,737 | 1,668 | 1,803 | 1,838 | 1,775 |
| 1998 | 1,696 | 1,912 | 1,699 | 1,787 | 1,887 | 1,953 | 2,042 | 1,971 | 2,006 | 1,865 | 1,814 | 2,034 |
| 1999 | 1,650 | 1,625 | 1,831 | 1,968 | 1,875 | 1,953 | 2,066 | 1,893 | 1,880 | 1,856 | 1,765 | 1,956 |
| 2000 | 1,729 | 1,857 | 1,764 | 1,852 | 1,881 | 1,917 | 1,845 | 2,001 | 1,881 | 1,678 | 1,816 | 1,909 |
| 2001 | 1,826 | 1,812 | 1,822 | 1,859 | 1,985 | 1,832 | 1,991 | 2,038 | 1,796 | 1,974 | 1,839 | 1,804 |
| 2002 | 1,796 | 1,862 | 1,912 | 2,001 | 2,090 | 1,998 | 2,086 | 2,110 | 1,938 | 1,971 | 1,869 | 1,898 |
| 2003 | 1,872 | 1,866 | 1,954 | 1,956 | 2,076 | 2,032 | 1,944 | 2,158 | 1,978 | 2,130 | 1,948 | 2,009 |
| 2004 | 1,869 | 1,866 | 2,095 | 1,945 | 1,866 | 2,034 | 2,150 | 2,179 | 2,058 | 1,966 | 1,948 | 2,013 |
| 2005 | 2,020 | 2,004 | 2,009 | 1,992 | 2,053 | 2,111 | 2,230 | 2,156 | 1,927 | 1,955 | 1,972 | 2,053 |
| 2006 | 1,957 | 1,869 | 2,116 | 2,053 | 2,084 | 2,098 | 2,193 | 2,250 | 2,010 | 2,080 | 2,114 | 2,050 |
| 2007 | 1,961 | 2,103 | 2,003 | 2,098 | 2,165 | 2,115 | 2,229 | 2,078 | 2,064 | 2,017 | 1,955 | 1,887 |
| 2008 | 2,013 | 1,838 | 2,019 | 1,958 | 2,104 | 2,034 | 2,044 | 2,032 | 1,809 | 1,770 | 1,759 | 1,820 |
| 2009 | 1,911 | 2,023 | 1,942 | 2,007 | 2,022 | 2,042 | 1,977 | 2,068 | 1,906 | 2,045 | 1,880 | 1,970 |
| 2010 | 1,910 | 1,790 | 1,902 | 1,982 | 1,954 | 2,021 | 2,063 | 1,993 | 1,968 | 1,981 | 1,808 | 1,903 |
| 2011 | 1,727 | 1,811 | 2,024 | 2,032 | 1,875 | 2,004 | 1,974 | 1,938 | 1,909 | 1,844 | 1,778 | 1,762 |
| 2012 | 1,845 | 1,820 | 1,897 | 1,857 | 1,959 | 1,924 | 1,926 | 2,001 | 1,809 | 1,974 | 2,010 | 1,845 |
| 2013 | 1,719 | 1,800 | 1,850 | 1,871 | 1,916 | 1,905 | 1,914 | 1,958 | 1,981 | 1,890 | 1,811 | 1,854 |
| 2014 | 1,772 | 1,914 | 1,888 | 2,031 | 1,914 | 1,889 | 1,920 | 1,964 | 1,859 | 2,033 | 1,990 | 1,956 |
| 2015 | 1,935 | 1,893 | 2,087 | 1,993 | 1,944 | 2,065 | 2,014 | 2,042 | 1,988 | 2,036 | 1,892 | 2,038 |
| 2016 | 1,909 | 1,968 | 2,226 | 2,068 | 2,009 | 2,055 | 2,062 | 2,096 | 1,995 | 2,005 | 2,061 | 1,949 |
| 2017 | 1,983 | 2,108 | 2,168 | 2,151 | 1,974 | 2,073 | 2,050 | 2,101 | 1,961 | 2,129 | 1,989 | 2,057 |
| 2018 | 1,876 | 1,987 | 2,059 | 2,075 | 2,081 | 2,105 | 2,105 | 2,089 | 2,134 | 2,000 | 2,059 | 2,079 |
| 2019 | 1,925 | 2,128 | 2,335 | 2,178 | 2,440 | 2,143 | 2,033 | 2,159 | 2,007 | 2,059 | 2,064 | 1,931 |
| 2020 | 1,988 | 1,986 | 1,862 | 1,419 | 1,630 | 1,986 | 1,906 | 2,024 | 2,015 | 2,105 | 1,808 | 1,881 |
| 2021 | 1,828 | 1,702 | 1,971 | 2,171 | 2,080 | 2,161 | 2,084 | 2,063 | 2,003 | 2,078 | 1,878 | 1,998 |
| 2022 | 1,784 | 1,855 | 1,940 | 1,937 | 1,926 | 2,021 | 1,818 | 1,990 | 1,882 | 1,931 | 1,949 | 1,883 |
| 2023 | 1,894 | 2,036 | 2,301 | 2,149 | 2,080 | 2,126 | 1,972 | 1,873 | 2,058 | 2,044 | 2,123 | 2,074 |
| 2024 | 1,915 | |||||||||||
| - = No Data Reported; -- = Not Applicable; NA = Not Available; W = Withheld to avoid disclosure of individual company data. |
| Release Date: 3/29/2024 |
| Next Release Date: 4/30/2024 |