|
Download Data (XLS File) |
|
||||||||
|
||||||||
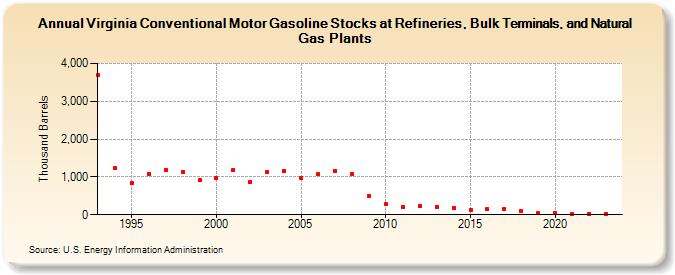
| Virginia Conventional Motor Gasoline Stocks at Refineries, Bulk Terminals, and Natural Gas Plants (Thousand Barrels) | ||||||||
| Decade | Year-0 | Year-1 | Year-2 | Year-3 | Year-4 | Year-5 | Year-6 | Year-7 | Year-8 | Year-9 |
|---|---|---|---|---|---|---|---|---|---|---|
| 1990's | 3,691 | 1,234 | 836 | 1,073 | 1,188 | 1,129 | 928 | |||
| 2000's | 982 | 1,184 | 869 | 1,141 | 1,157 | 977 | 1,066 | 1,167 | 1,086 | 489 |
| 2010's | 274 | 213 | 235 | 214 | 189 | 134 | 150 | 150 | 91 | 44 |
| 2020's | 41 | 29 | 22 | 21 |
| - = No Data Reported; -- = Not Applicable; NA = Not Available; W = Withheld to avoid disclosure of individual company data. |
| Release Date: 3/29/2024 |
| Next Release Date: 8/30/2024 |