|
Download Data (XLS File) |
|
||||||||
|
||||||||
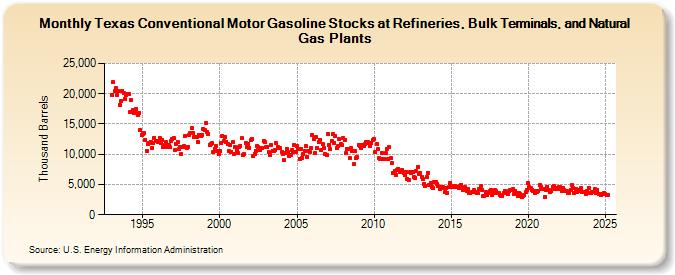
| Texas Conventional Motor Gasoline Stocks at Refineries, Bulk Terminals, and Natural Gas Plants (Thousand Barrels) | ||||||||
| Year | Jan | Feb | Mar | Apr | May | Jun | Jul | Aug | Sep | Oct | Nov | Dec |
|---|---|---|---|---|---|---|---|---|---|---|---|---|
| 1993 | 19,865 | 21,889 | 20,383 | 20,975 | 19,830 | 20,408 | 18,194 | 18,728 | 20,522 | 20,136 | 19,109 | 19,722 |
| 1994 | 19,921 | 19,962 | 16,992 | 18,930 | 17,241 | 16,886 | 16,969 | 17,473 | 16,412 | 16,732 | 14,028 | 13,129 |
| 1995 | 13,389 | 13,459 | 12,420 | 10,544 | 11,717 | 11,937 | 12,036 | 10,991 | 11,905 | 12,649 | 12,160 | 12,176 |
| 1996 | 11,971 | 12,700 | 11,819 | 12,363 | 11,151 | 11,485 | 11,950 | 11,254 | 11,533 | 11,148 | 12,133 | 12,589 |
| 1997 | 12,711 | 10,732 | 11,685 | 12,065 | 10,866 | 11,164 | 10,067 | 11,271 | 11,382 | 13,016 | 11,043 | 11,169 |
| 1998 | 13,203 | 13,472 | 14,277 | 13,446 | 12,781 | 12,868 | 12,899 | 12,092 | 13,169 | 13,035 | 13,180 | 14,214 |
| 1999 | 14,013 | 15,152 | 13,700 | 13,370 | 11,582 | 11,619 | 11,776 | 10,299 | 10,937 | 11,392 | 10,482 | 10,107 |
| 2000 | 10,588 | 11,799 | 13,067 | 12,240 | 12,899 | 12,084 | 11,639 | 10,487 | 11,591 | 10,346 | 11,949 | 10,119 |
| 2001 | 11,170 | 10,687 | 10,190 | 11,214 | 11,408 | 12,645 | 9,841 | 9,995 | 11,856 | 11,179 | 11,747 | 11,052 |
| 2002 | 12,322 | 12,519 | 9,652 | 10,090 | 10,577 | 11,383 | 11,116 | 10,734 | 11,086 | 10,994 | 12,206 | 11,971 |
| 2003 | 11,143 | 11,264 | 10,343 | 9,921 | 11,534 | 10,582 | 10,552 | 10,709 | 11,796 | 11,147 | 10,999 | 10,957 |
| 2004 | 10,331 | 10,064 | 9,109 | 10,132 | 10,893 | 10,361 | 9,761 | 9,852 | 10,649 | 10,441 | 11,552 | 10,367 |
| 2005 | 11,437 | 10,799 | 9,237 | 10,928 | 9,445 | 9,968 | 10,487 | 11,327 | 9,566 | 10,581 | 10,320 | 11,097 |
| 2006 | 13,159 | 12,438 | 10,205 | 12,782 | 11,043 | 12,044 | 12,408 | 10,616 | 11,708 | 11,014 | 10,111 | 9,806 |
| 2007 | 13,392 | 11,525 | 10,809 | 12,217 | 13,317 | 11,912 | 13,028 | 11,084 | 11,283 | 12,443 | 11,726 | 11,559 |
| 2008 | 12,685 | 12,418 | 10,151 | 10,900 | 10,909 | 9,317 | 10,997 | 10,556 | 8,319 | 10,455 | 9,329 | 9,530 |
| 2009 | 11,576 | 11,394 | 11,035 | 11,546 | 11,396 | 11,633 | 12,067 | 12,041 | 11,778 | 11,312 | 11,797 | 12,402 |
| 2010 | 12,563 | 10,293 | 11,708 | 10,848 | 9,319 | 9,285 | 10,157 | 9,283 | 9,222 | 10,120 | 10,909 | 9,218 |
| 2011 | 11,177 | 9,317 | 8,478 | 6,918 | 7,223 | 6,613 | 7,441 | 7,623 | 7,108 | 7,218 | 7,383 | 6,945 |
| 2012 | 6,484 | 7,080 | 5,919 | 5,790 | 7,040 | 6,898 | 6,994 | 6,188 | 6,138 | 7,219 | 7,969 | 6,804 |
| 2013 | 6,948 | 6,291 | 5,874 | 5,133 | 4,786 | 6,274 | 6,911 | 4,974 | 5,279 | 4,547 | 4,348 | 5,462 |
| 2014 | 5,377 | 5,078 | 4,697 | 4,265 | 4,613 | 4,376 | 4,518 | 3,716 | 4,407 | 3,636 | 4,562 | 5,244 |
| 2015 | 4,726 | 4,499 | 4,568 | 4,816 | 4,614 | 4,554 | 4,346 | 4,829 | 4,972 | 4,155 | 4,473 | 4,519 |
| 2016 | 3,991 | 4,229 | 3,601 | 3,559 | 3,698 | 3,704 | 4,056 | 3,677 | 3,607 | 3,544 | 4,192 | 4,737 |
| 2017 | 4,128 | 3,065 | 3,157 | 3,794 | 3,322 | 3,591 | 3,847 | 4,158 | 3,214 | 3,581 | 4,013 | 3,855 |
| 2018 | 3,523 | 3,645 | 3,310 | 3,170 | 3,157 | 3,626 | 3,967 | 3,726 | 3,394 | 3,868 | 4,067 | 4,092 |
| 2019 | 4,169 | 3,501 | 3,964 | 3,583 | 3,129 | 3,662 | 3,411 | 2,851 | 3,051 | 3,319 | 3,734 | 4,069 |
| 2020 | 5,208 | 4,609 | 4,461 | 4,087 | 3,999 | 3,646 | 3,996 | 3,686 | 3,964 | 4,884 | 4,656 | 4,223 |
| 2021 | 4,212 | 2,857 | 4,142 | 4,650 | 4,005 | 3,795 | 3,867 | 4,626 | 4,731 | 4,215 | 4,338 | 4,284 |
| 2022 | 4,616 | 4,561 | 3,949 | 4,491 | 4,113 | 3,962 | 3,872 | 3,577 | 3,670 | 4,116 | 4,925 | 4,417 |
| 2023 | 3,600 | 4,296 | 3,706 | 4,126 | 3,893 | 4,368 | 3,706 | 3,806 | 3,757 | 3,355 | 3,963 | 4,414 |
| 2024 | 3,651 | 3,535 | 3,709 | 3,765 | 4,176 | 3,574 | ||||||
| - = No Data Reported; -- = Not Applicable; NA = Not Available; W = Withheld to avoid disclosure of individual company data. |
| Release Date: 8/30/2024 |
| Next Release Date: 9/30/2024 |