|
Download Data (XLS File) |
|
||||||||
|
||||||||
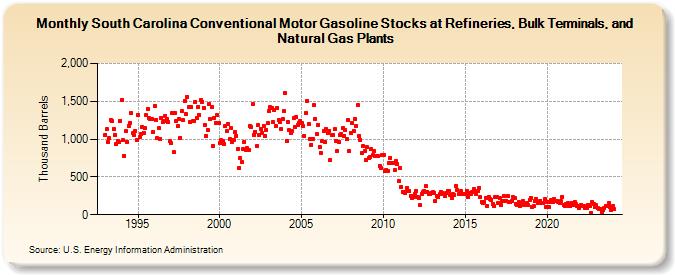
| South Carolina Conventional Motor Gasoline Stocks at Refineries, Bulk Terminals, and Natural Gas Plants (Thousand Barrels) | ||||||||
| Year | Jan | Feb | Mar | Apr | May | Jun | Jul | Aug | Sep | Oct | Nov | Dec |
|---|---|---|---|---|---|---|---|---|---|---|---|---|
| 1993 | 1,060 | 1,127 | 964 | 1,012 | 1,255 | 1,239 | 1,131 | 1,059 | 935 | 971 | 960 | 1,245 |
| 1994 | 1,521 | 985 | 780 | 1,102 | 967 | 1,174 | 1,216 | 1,348 | 1,079 | 1,050 | 1,112 | 986 |
| 1995 | 1,325 | 1,032 | 1,070 | 1,162 | 1,086 | 1,146 | 1,313 | 1,401 | 1,279 | 1,267 | 1,261 | 1,092 |
| 1996 | 1,436 | 1,256 | 1,009 | 1,141 | 1,006 | 1,284 | 1,226 | 1,236 | 1,312 | 1,267 | 1,229 | 969 |
| 1997 | 943 | 1,339 | 828 | 1,347 | 1,244 | 1,168 | 1,269 | 1,016 | 1,367 | 1,247 | 1,509 | 1,335 |
| 1998 | 1,561 | 1,418 | 1,229 | 1,423 | 1,233 | 1,243 | 1,495 | 1,280 | 1,431 | 1,316 | 1,523 | 1,497 |
| 1999 | 1,415 | 1,187 | 1,041 | 1,121 | 1,460 | 1,266 | 1,431 | 912 | 1,284 | 1,210 | 1,315 | 1,210 |
| 2000 | 949 | 984 | 976 | 930 | 1,173 | 1,103 | 1,205 | 995 | 1,152 | 963 | 994 | 1,090 |
| 2001 | 1,041 | 872 | 621 | 750 | 698 | 869 | 968 | 853 | 876 | 862 | 1,175 | 1,160 |
| 2002 | 1,464 | 1,060 | 1,100 | 907 | 1,181 | 1,048 | 1,137 | 1,087 | 1,175 | 1,042 | 1,123 | 1,212 |
| 2003 | 1,376 | 1,419 | 1,409 | 1,223 | 1,382 | 1,171 | 1,415 | 1,250 | 1,231 | 1,132 | 1,271 | 1,367 |
| 2004 | 1,609 | 979 | 1,231 | 1,114 | 1,081 | 1,106 | 1,276 | 1,160 | 1,293 | 1,183 | 1,213 | 1,238 |
| 2005 | 1,208 | 1,172 | 1,045 | 1,345 | 1,507 | 1,202 | 999 | 927 | 1,004 | 1,446 | 1,268 | 1,061 |
| 2006 | 1,190 | 898 | 817 | 976 | 1,108 | 965 | 1,135 | 1,076 | 1,113 | 728 | 1,050 | 1,059 |
| 2007 | 1,129 | 981 | 840 | 956 | 1,049 | 1,071 | 1,141 | 1,040 | 1,117 | 998 | 1,254 | 839 |
| 2008 | 1,084 | 1,212 | 1,113 | 1,272 | 1,171 | 1,447 | 1,047 | 990 | 814 | 907 | 838 | 720 |
| 2009 | 889 | 753 | 766 | 869 | 788 | 844 | 780 | 781 | 776 | 649 | 622 | 787 |
| 2010 | 792 | 577 | 593 | 582 | 681 | 751 | 679 | 687 | 591 | 708 | 670 | 444 |
| 2011 | 614 | 372 | 307 | 305 | 286 | 359 | 309 | 311 | 252 | 219 | 231 | 276 |
| 2012 | 313 | 234 | 223 | 128 | 279 | 302 | 317 | 379 | 307 | 270 | 272 | 288 |
| 2013 | 298 | 292 | 184 | 250 | 237 | 271 | 306 | 293 | 275 | 241 | 282 | 315 |
| 2014 | 318 | 264 | 220 | 270 | 264 | 382 | 328 | 270 | 276 | 308 | 278 | 273 |
| 2015 | 278 | 315 | 232 | 282 | 277 | 300 | 337 | 310 | 269 | 318 | 359 | 232 |
| 2016 | 173 | 155 | 171 | 219 | 118 | 235 | 212 | 198 | 144 | 113 | 228 | 228 |
| 2017 | 155 | 224 | 126 | 179 | 250 | 186 | 185 | 250 | 166 | 172 | 181 | 228 |
| 2018 | 227 | 145 | 122 | 165 | 121 | 152 | 176 | 130 | 143 | 152 | 126 | 193 |
| 2019 | 223 | 101 | 114 | 182 | 211 | 149 | 164 | 186 | 154 | 157 | 202 | 108 |
| 2020 | 170 | 102 | 168 | 200 | 162 | 204 | 178 | 183 | 164 | 150 | 180 | 240 |
| 2021 | 129 | 121 | 148 | 149 | 113 | 111 | 160 | 130 | 169 | 140 | 117 | 89 |
| 2022 | 111 | 135 | 111 | 117 | 91 | 95 | 130 | 120 | 22 | 164 | 145 | 98 |
| 2023 | 124 | 91 | 74 | 82 | 39 | 62 | 94 | 116 | 121 | 151 | 100 | 62 |
| 2024 | 110 | |||||||||||
| - = No Data Reported; -- = Not Applicable; NA = Not Available; W = Withheld to avoid disclosure of individual company data. |
| Release Date: 3/29/2024 |
| Next Release Date: 4/30/2024 |