|
Download Data (XLS File) |
|
||||||||
|
||||||||
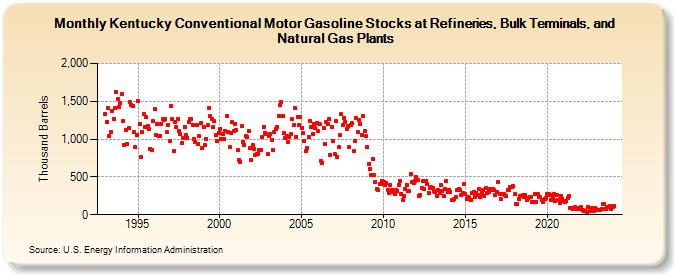
| Kentucky Conventional Motor Gasoline Stocks at Refineries, Bulk Terminals, and Natural Gas Plants (Thousand Barrels) | ||||||||
| Year | Jan | Feb | Mar | Apr | May | Jun | Jul | Aug | Sep | Oct | Nov | Dec |
|---|---|---|---|---|---|---|---|---|---|---|---|---|
| 1993 | 1,331 | 1,231 | 1,416 | 1,040 | 1,092 | 1,371 | 1,272 | 1,414 | 1,620 | 1,528 | 1,430 | 1,473 |
| 1994 | 1,595 | 1,242 | 927 | 1,119 | 937 | 1,145 | 1,496 | 1,450 | 1,437 | 1,093 | 894 | 1,054 |
| 1995 | 1,502 | 1,194 | 768 | 1,099 | 1,334 | 1,166 | 1,290 | 1,170 | 1,135 | 866 | 855 | 1,235 |
| 1996 | 1,399 | 1,050 | 1,195 | 1,041 | 1,045 | 1,205 | 1,261 | 1,253 | 1,263 | 1,098 | 1,189 | 971 |
| 1997 | 1,440 | 1,262 | 843 | 1,220 | 1,162 | 1,270 | 1,101 | 1,066 | 954 | 1,018 | 1,162 | 1,058 |
| 1998 | 1,020 | 1,223 | 1,267 | 1,269 | 1,184 | 1,003 | 958 | 1,185 | 940 | 1,041 | 1,216 | 887 |
| 1999 | 1,163 | 923 | 1,006 | 1,181 | 1,405 | 1,306 | 1,265 | 1,157 | 1,234 | 1,051 | 978 | 1,086 |
| 2000 | 1,137 | 1,005 | 1,071 | 1,000 | 1,104 | 1,308 | 1,096 | 893 | 1,075 | 1,222 | 1,107 | 1,206 |
| 2001 | 1,114 | 855 | 729 | 699 | 1,173 | 968 | 927 | 1,043 | 1,033 | 1,110 | 877 | 720 |
| 2002 | 917 | 866 | 793 | 804 | 805 | 858 | 854 | 1,023 | 1,162 | 1,087 | 1,061 | 804 |
| 2003 | 1,036 | 1,061 | 985 | 857 | 1,093 | 1,132 | 1,157 | 1,309 | 1,447 | 1,486 | 1,311 | 1,076 |
| 2004 | 1,011 | 1,039 | 962 | 1,028 | 1,067 | 1,269 | 1,180 | 1,405 | 1,033 | 1,295 | 1,190 | 1,296 |
| 2005 | 1,153 | 1,082 | 971 | 843 | 888 | 1,031 | 1,241 | 1,164 | 1,068 | 1,197 | 1,145 | 1,208 |
| 2006 | 1,103 | 1,194 | 715 | 689 | 1,153 | 933 | 1,228 | 1,202 | 1,263 | 795 | 1,166 | 969 |
| 2007 | 800 | 1,239 | 761 | 892 | 1,059 | 1,327 | 1,185 | 1,284 | 1,231 | 1,135 | 1,172 | 889 |
| 2008 | 1,189 | 1,208 | 837 | 977 | 1,278 | 1,088 | 1,256 | 1,204 | 1,048 | 1,300 | 1,102 | 1,045 |
| 2009 | 898 | 666 | 607 | 530 | 743 | 525 | 436 | 345 | 324 | 405 | 403 | 450 |
| 2010 | 429 | 397 | 416 | 333 | 293 | 388 | 326 | 300 | 274 | 326 | 314 | 393 |
| 2011 | 450 | 278 | 196 | 246 | 341 | 389 | 310 | 310 | 544 | 433 | 415 | 449 |
| 2012 | 498 | 465 | 241 | 265 | 352 | 446 | 337 | 447 | 400 | 289 | 355 | 360 |
| 2013 | 349 | 310 | 302 | 254 | 326 | 288 | 395 | 317 | 251 | 338 | 440 | 306 |
| 2014 | 328 | 303 | 200 | 195 | 202 | 240 | 329 | 345 | 322 | 257 | 289 | 401 |
| 2015 | 280 | 213 | 228 | 227 | 191 | 281 | 305 | 231 | 291 | 265 | 343 | 238 |
| 2016 | 288 | 324 | 245 | 347 | 288 | 305 | 342 | 324 | 346 | 325 | 264 | 299 |
| 2017 | 438 | 272 | 214 | 279 | 276 | 257 | 247 | 332 | 333 | 362 | 361 | 378 |
| 2018 | 279 | 147 | 137 | 211 | 242 | 252 | 261 | 238 | 257 | 189 | 217 | 228 |
| 2019 | 230 | 168 | 172 | 280 | 174 | 272 | 229 | 229 | 192 | 174 | 210 | 225 |
| 2020 | 273 | 270 | 265 | 194 | 218 | 280 | 178 | 261 | 198 | 158 | 241 | 208 |
| 2021 | 185 | 170 | 183 | 221 | 248 | 83 | 94 | 78 | 98 | 71 | 78 | 89 |
| 2022 | 81 | 103 | 63 | 54 | 53 | 40 | 100 | 47 | 60 | 86 | 49 | 85 |
| 2023 | 76 | 63 | 61 | 63 | 76 | 143 | 136 | 81 | 108 | 107 | 113 | 73 |
| 2024 | 100 | |||||||||||
| - = No Data Reported; -- = Not Applicable; NA = Not Available; W = Withheld to avoid disclosure of individual company data. |
| Release Date: 3/29/2024 |
| Next Release Date: 4/30/2024 |