|
Download Data (XLS File) |
|
||||||||
|
||||||||
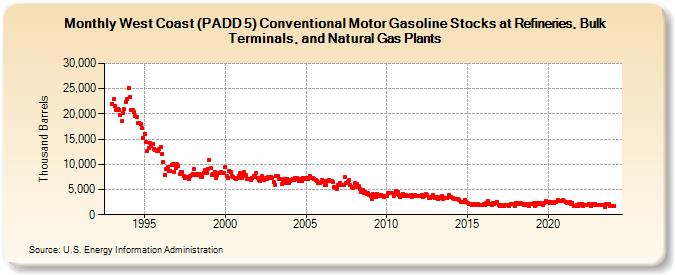
| West Coast (PADD 5) Conventional Motor Gasoline Stocks at Refineries, Bulk Terminals, and Natural Gas Plants (Thousand Barrels) | ||||||||
| Year | Jan | Feb | Mar | Apr | May | Jun | Jul | Aug | Sep | Oct | Nov | Dec |
|---|---|---|---|---|---|---|---|---|---|---|---|---|
| 1993 | 22,021 | 22,896 | 21,609 | 20,767 | 20,993 | 20,836 | 19,832 | 18,584 | 20,221 | 20,877 | 22,347 | 23,002 |
| 1994 | 25,194 | 23,309 | 20,749 | 20,835 | 20,301 | 19,568 | 19,288 | 18,131 | 18,192 | 18,029 | 17,193 | 15,148 |
| 1995 | 16,062 | 14,479 | 12,697 | 13,198 | 14,229 | 13,565 | 14,122 | 13,063 | 12,891 | 12,616 | 12,611 | 13,036 |
| 1996 | 13,466 | 12,115 | 10,380 | 7,935 | 9,039 | 9,512 | 8,649 | 8,678 | 9,892 | 10,092 | 8,551 | 9,285 |
| 1997 | 9,979 | 9,715 | 8,020 | 8,456 | 8,564 | 7,683 | 7,229 | 7,409 | 7,463 | 7,051 | 7,668 | 7,966 |
| 1998 | 8,057 | 8,988 | 7,862 | 8,119 | 7,893 | 8,062 | 7,552 | 7,470 | 8,298 | 8,882 | 8,226 | 9,130 |
| 1999 | 10,823 | 9,239 | 7,903 | 7,996 | 8,480 | 7,371 | 7,782 | 8,319 | 8,307 | 8,570 | 8,262 | 8,217 |
| 2000 | 9,466 | 7,692 | 7,244 | 8,703 | 8,421 | 7,655 | 7,487 | 7,191 | 7,119 | 7,317 | 7,613 | 8,220 |
| 2001 | 7,290 | 7,719 | 8,378 | 7,792 | 7,019 | 7,131 | 7,119 | 6,883 | 7,216 | 7,667 | 7,559 | 8,275 |
| 2002 | 7,213 | 6,885 | 6,721 | 7,581 | 7,145 | 6,876 | 7,207 | 7,161 | 7,424 | 7,370 | 7,432 | 7,328 |
| 2003 | 6,407 | 5,894 | 7,680 | 7,770 | 7,080 | 7,035 | 6,047 | 6,980 | 7,144 | 6,323 | 7,122 | 6,259 |
| 2004 | 6,743 | 6,871 | 7,078 | 6,972 | 7,304 | 7,203 | 7,000 | 6,777 | 7,013 | 6,732 | 7,325 | 7,046 |
| 2005 | 7,333 | 7,046 | 7,267 | 7,628 | 7,282 | 7,282 | 7,140 | 6,889 | 6,745 | 6,378 | 6,331 | 6,465 |
| 2006 | 6,818 | 6,645 | 5,970 | 5,881 | 6,669 | 6,915 | 6,709 | 6,671 | 6,429 | 5,564 | 5,285 | 5,172 |
| 2007 | 5,895 | 6,345 | 5,982 | 5,841 | 5,866 | 7,400 | 6,380 | 6,462 | 6,791 | 5,934 | 5,496 | 5,328 |
| 2008 | 6,243 | 5,451 | 6,016 | 5,620 | 5,011 | 4,590 | 4,950 | 4,274 | 4,558 | 4,169 | 4,225 | 3,846 |
| 2009 | 3,732 | 3,212 | 4,080 | 3,766 | 3,496 | 4,042 | 3,750 | 3,880 | 3,978 | 3,674 | 3,442 | 3,645 |
| 2010 | 3,664 | 4,229 | 4,225 | 4,211 | 4,351 | 3,803 | 4,097 | 4,636 | 4,530 | 3,838 | 3,559 | 3,707 |
| 2011 | 4,113 | 3,710 | 3,907 | 3,712 | 3,683 | 3,704 | 3,935 | 3,574 | 3,838 | 4,003 | 3,662 | 3,623 |
| 2012 | 3,698 | 3,763 | 3,962 | 3,480 | 3,763 | 4,045 | 3,817 | 3,317 | 3,298 | 3,604 | 3,868 | 3,568 |
| 2013 | 3,395 | 3,493 | 3,104 | 3,318 | 3,472 | 3,769 | 3,116 | 3,322 | 3,411 | 3,304 | 3,867 | 3,519 |
| 2014 | 3,501 | 3,260 | 3,070 | 3,072 | 3,029 | 3,045 | 2,864 | 2,580 | 2,487 | 2,574 | 2,963 | 2,570 |
| 2015 | 2,317 | 2,068 | 2,151 | 1,849 | 1,845 | 2,153 | 1,949 | 1,917 | 2,033 | 1,872 | 1,904 | 1,833 |
| 2016 | 2,078 | 1,956 | 2,268 | 2,688 | 2,161 | 2,029 | 1,927 | 2,284 | 2,141 | 2,249 | 2,565 | 2,015 |
| 2017 | 1,811 | 1,882 | 1,777 | 1,739 | 1,917 | 1,959 | 1,918 | 1,658 | 2,078 | 2,111 | 2,067 | 1,748 |
| 2018 | 2,406 | 2,307 | 2,177 | 2,315 | 2,301 | 2,169 | 1,881 | 1,994 | 2,190 | 1,941 | 1,820 | 2,028 |
| 2019 | 2,146 | 2,299 | 1,825 | 2,006 | 2,362 | 2,182 | 2,405 | 2,032 | 2,014 | 2,334 | 2,642 | 2,500 |
| 2020 | 2,485 | 2,377 | 2,555 | 2,343 | 2,325 | 2,466 | 2,522 | 2,933 | 2,637 | 2,753 | 2,629 | 2,859 |
| 2021 | 2,732 | 2,560 | 2,230 | 2,358 | 2,483 | 2,027 | 2,280 | 1,791 | 1,764 | 1,967 | 1,725 | 2,058 |
| 2022 | 2,001 | 2,137 | 1,777 | 1,965 | 1,940 | 1,873 | 2,117 | 1,852 | 1,692 | 2,192 | 1,880 | 2,171 |
| 2023 | 2,002 | 1,856 | 2,010 | 1,943 | 1,993 | 1,967 | 1,546 | 2,127 | 2,170 | 2,074 | 1,793 | 1,730 |
| 2024 | 1,777 | |||||||||||
| - = No Data Reported; -- = Not Applicable; NA = Not Available; W = Withheld to avoid disclosure of individual company data. |
| Release Date: 3/29/2024 |
| Next Release Date: 4/30/2024 |