|
Download Data (XLS File) |
|
||||||||
|
||||||||
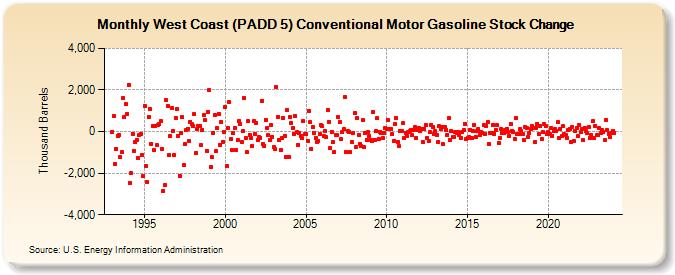
| West Coast (PADD 5) Conventional Motor Gasoline Stock Change (Thousand Barrels) | ||||||||
| Year | Jan | Feb | Mar | Apr | May | Jun | Jul | Aug | Sep | Oct | Nov | Dec |
|---|---|---|---|---|---|---|---|---|---|---|---|---|
| 1993 | 0 | 733 | -1,550 | -822 | -219 | -150 | -1,236 | -1,001 | 1,602 | 676 | 1,317 | 848 |
| 1994 | 2,259 | -2,459 | -2,001 | -99 | -929 | -491 | -386 | -1,271 | -154 | -111 | -1,121 | -2,126 |
| 1995 | 1,235 | -1,649 | -2,435 | 719 | 1,105 | -583 | 245 | -908 | 246 | -669 | 322 | 355 |
| 1996 | 490 | -820 | -2,847 | -2,583 | 1,494 | 1,231 | -1,123 | -216 | 1,111 | 50 | -1,132 | 656 |
| 1997 | 1,081 | -201 | -2,114 | -46 | 686 | -1,616 | -601 | 84 | 144 | -450 | 480 | 353 |
| 1998 | 267 | 826 | -1,020 | 102 | 266 | 252 | -670 | 89 | 775 | 552 | -944 | 954 |
| 1999 | 1,999 | -1,702 | -1,232 | -63 | 786 | -952 | 169 | 865 | -625 | 480 | -493 | -32 |
| 2000 | 1,196 | -1,666 | 179 | 1,431 | -369 | -896 | -82 | 190 | -882 | -417 | 503 | 383 |
| 2001 | -495 | 17 | 1,605 | -309 | -998 | 487 | -144 | -306 | -674 | 489 | -120 | 416 |
| 2002 | -399 | -270 | -288 | 1,487 | -615 | -681 | 573 | 159 | -156 | -423 | 297 | -256 |
| 2003 | -742 | -846 | 2,134 | 702 | -410 | -868 | -324 | 645 | -206 | -1,207 | 1,039 | -1,247 |
| 2004 | 698 | 432 | 188 | -99 | 768 | -34 | -645 | -80 | -201 | -325 | 484 | -116 |
| 2005 | -113 | -435 | 1,011 | 440 | -831 | 207 | -66 | -301 | -510 | -441 | -114 | 295 |
| 2006 | 261 | -236 | 10 | -272 | 1,015 | 483 | -782 | -6 | -517 | -962 | -160 | -162 |
| 2007 | 687 | 463 | -350 | -20 | 129 | 1,663 | -991 | 16 | -11 | -994 | -488 | -64 |
| 2008 | 884 | -751 | 669 | -157 | -582 | -693 | 540 | -748 | -93 | -401 | -40 | -207 |
| 2009 | -392 | -444 | 948 | -405 | 20 | 629 | -381 | -8 | -53 | -315 | -75 | 172 |
| 2010 | 117 | 549 | 120 | 112 | -138 | -445 | 353 | 653 | -496 | -707 | 24 | 50 |
| 2011 | 389 | -327 | -70 | -211 | 2 | 31 | 95 | -177 | 96 | 213 | -310 | 58 |
| 2012 | 155 | 47 | 134 | -499 | 144 | 302 | -305 | -459 | -22 | 332 | 236 | -135 |
| 2013 | 3 | -153 | -487 | 252 | 144 | 235 | -605 | 221 | 90 | -157 | 641 | -392 |
| 2014 | 14 | -252 | -261 | -13 | -71 | -22 | -158 | -301 | -32 | 72 | 386 | -352 |
| 2015 | -305 | -279 | 92 | -315 | 11 | 312 | -245 | 6 | 123 | -167 | -15 | -49 |
| 2016 | 299 | -130 | 287 | 436 | -589 | -80 | -86 | 339 | -101 | 94 | 299 | -528 |
| 2017 | -288 | 111 | -59 | -68 | 93 | 144 | -28 | -204 | 365 | 37 | -13 | -345 |
| 2018 | 661 | -122 | -101 | 103 | 38 | -138 | -389 | 213 | 165 | -261 | -86 | 99 |
| 2019 | 261 | 149 | -481 | 166 | 358 | -139 | 245 | -362 | -42 | 342 | 256 | -135 |
| 2020 | -30 | -100 | 153 | -199 | 11 | 124 | 30 | 445 | -309 | 144 | -229 | 251 |
| 2021 | -141 | -178 | -296 | 89 | 129 | -504 | 235 | -471 | 23 | 176 | -235 | 325 |
| 2022 | -34 | 131 | -402 | 188 | 14 | -86 | 230 | -300 | -162 | 507 | -318 | 290 |
| 2023 | -164 | -149 | 151 | -52 | 55 | -24 | -426 | 563 | 61 | -103 | -263 | -74 |
| 2024 | 45 | |||||||||||
| - = No Data Reported; -- = Not Applicable; NA = Not Available; W = Withheld to avoid disclosure of individual company data. |
| Release Date: 3/29/2024 |
| Next Release Date: 4/30/2024 |