|
Download Data (XLS File) |
|
||||||||
|
||||||||
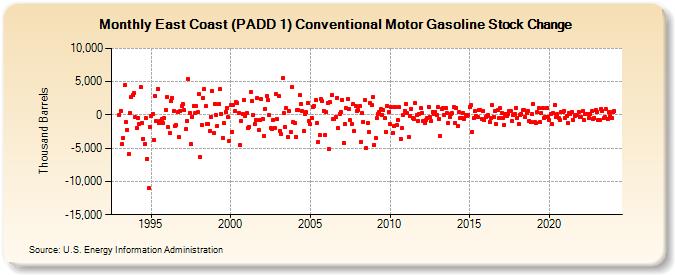
| East Coast (PADD 1) Conventional Motor Gasoline Stock Change (Thousand Barrels) | ||||||||
| Year | Jan | Feb | Mar | Apr | May | Jun | Jul | Aug | Sep | Oct | Nov | Dec |
|---|---|---|---|---|---|---|---|---|---|---|---|---|
| 1993 | 0 | 658 | -4,402 | -3,441 | 4,495 | -1,086 | -2,214 | -5,876 | 323 | 2,705 | 2,949 | 3,289 |
| 1994 | -385 | -1,911 | -408 | -1,380 | 4,211 | -1,200 | -3,554 | -4,361 | -501 | -6,591 | -11,048 | -1,745 |
| 1995 | -173 | 150 | -3,739 | 2,790 | -988 | 3,914 | -1,217 | -952 | -569 | -1,269 | -538 | 764 |
| 1996 | 2,697 | -1,874 | -2,739 | 2,149 | 2,560 | 604 | -1,680 | -1,555 | 408 | -3,355 | 600 | 1,269 |
| 1997 | 1,584 | 721 | -2,137 | -926 | 5,326 | 339 | -4,391 | -271 | 1,366 | 278 | 1,279 | 395 |
| 1998 | 3,140 | -6,315 | -1,506 | 2,536 | 3,882 | 1,276 | -1,376 | -1,394 | -2,442 | -291 | 3,625 | -2,682 |
| 1999 | 1,714 | -11 | -1,664 | 1,577 | 3,844 | 164 | -3,432 | -1,276 | 442 | 1,054 | -328 | -3,898 |
| 2000 | 1,419 | -2,515 | 1,562 | 544 | 1,939 | 1,746 | 294 | -4,490 | -891 | 200 | 2,184 | -217 |
| 2001 | 263 | -1,975 | -1,760 | 3,461 | 2,034 | -11 | -1,375 | -738 | 2,479 | -2,268 | -708 | 2,341 |
| 2002 | -539 | -3,179 | 942 | 2,828 | 2,244 | -87 | -1,969 | -2,091 | -756 | -1,900 | 3,096 | -603 |
| 2003 | 2,825 | -2,386 | -2,911 | 5,477 | 282 | -1,802 | 1,012 | -3,343 | 622 | -2,593 | 4,177 | -1,074 |
| 2004 | -1,228 | -3,273 | 707 | 736 | 2,930 | 1,697 | 525 | -2,446 | 66 | 383 | 1,764 | -915 |
| 2005 | -1,421 | -493 | 1,146 | 1,336 | 2,186 | -1,141 | -4,038 | -3,050 | 2,327 | 2,035 | 639 | -3,023 |
| 2006 | 378 | 1,846 | -5,131 | 1,899 | 2,974 | -655 | -547 | -320 | 2,594 | -1,956 | 209 | 466 |
| 2007 | 2,214 | -4,158 | -1,387 | 986 | 2,348 | 870 | -821 | -1,352 | 1,625 | -2,442 | 1,370 | 656 |
| 2008 | 729 | 1,294 | -4,018 | 243 | -1,054 | 2,204 | -4,984 | -1,225 | -2,578 | 1,765 | 1,480 | 2,686 |
| 2009 | -4,518 | -3,414 | -512 | 149 | 493 | 847 | 55 | 738 | -470 | -2,500 | 1,376 | 414 |
| 2010 | -1,432 | 1,185 | -2,704 | -1,736 | 1,201 | -1,447 | -776 | 1,140 | -3,545 | -1,994 | 13 | 631 |
| 2011 | 1,686 | 219 | -3,333 | -104 | 943 | -450 | -547 | 1,818 | 60 | -898 | 196 | 998 |
| 2012 | 319 | -955 | -1,160 | -804 | -432 | 1,239 | -255 | -855 | 457 | 171 | 488 | -78 |
| 2013 | 1,139 | -600 | -3,173 | 933 | 1,072 | 59 | 993 | 245 | -1,194 | -350 | 188 | 234 |
| 2014 | 1,179 | -1,204 | 1,115 | -1,700 | 372 | -418 | -400 | 298 | -562 | 6 | -146 | -38 |
| 2015 | 1,157 | 1,468 | -2,605 | -534 | 525 | -146 | -319 | 781 | 762 | -565 | 625 | -703 |
| 2016 | -339 | -172 | -64 | -1,038 | -455 | 1,520 | -247 | 536 | -1,394 | 703 | -410 | 999 |
| 2017 | 346 | -388 | -1,502 | 133 | -106 | 128 | 528 | 523 | -985 | 39 | 201 | 1,103 |
| 2018 | -453 | -1,406 | 22 | 166 | 686 | 694 | -374 | 232 | 618 | -860 | -1,121 | 165 |
| 2019 | 1,622 | -1,054 | -1,216 | 427 | 980 | -1,138 | 251 | 1,001 | -536 | -278 | 1,077 | -382 |
| 2020 | -773 | 200 | -1,388 | 260 | 1,513 | -341 | 88 | -393 | -749 | 464 | 438 | 609 |
| 2021 | -426 | -102 | -1,247 | 333 | 110 | 439 | -727 | -137 | -49 | 10 | 474 | -300 |
| 2022 | -281 | 534 | -698 | 119 | 181 | 86 | -397 | 186 | 526 | -559 | -406 | 688 |
| 2023 | 420 | -780 | -743 | 879 | 622 | -523 | -242 | 838 | -653 | 373 | -201 | -499 |
| 2024 | 427 | |||||||||||
| - = No Data Reported; -- = Not Applicable; NA = Not Available; W = Withheld to avoid disclosure of individual company data. |
| Release Date: 3/29/2024 |
| Next Release Date: 4/30/2024 |