|
Download Data (XLS File) |
|
||||||||
|
||||||||
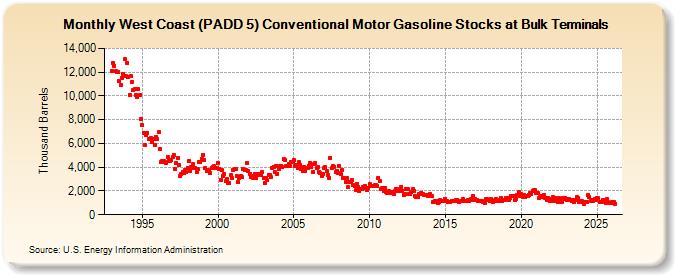
| West Coast (PADD 5) Conventional Motor Gasoline Stocks at Bulk Terminals (Thousand Barrels) | ||||||||
| Year | Jan | Feb | Mar | Apr | May | Jun | Jul | Aug | Sep | Oct | Nov | Dec |
|---|---|---|---|---|---|---|---|---|---|---|---|---|
| 1993 | 12,136 | 12,769 | 12,554 | 12,073 | 12,022 | 11,995 | 11,282 | 10,921 | 11,520 | 11,808 | 13,103 | 11,649 |
| 1994 | 12,800 | 11,580 | 10,100 | 11,659 | 11,209 | 10,476 | 10,578 | 10,042 | 9,948 | 10,551 | 10,047 | 8,059 |
| 1995 | 7,529 | 6,906 | 5,884 | 6,681 | 6,892 | 6,364 | 6,350 | 6,440 | 6,120 | 6,345 | 5,871 | 6,574 |
| 1996 | 6,376 | 6,936 | 5,505 | 4,396 | 4,504 | 4,553 | 4,465 | 4,383 | 4,866 | 4,549 | 4,522 | 4,643 |
| 1997 | 4,877 | 5,007 | 3,836 | 4,356 | 4,794 | 4,149 | 3,299 | 3,467 | 3,579 | 3,546 | 3,798 | 3,593 |
| 1998 | 3,958 | 4,488 | 3,709 | 4,014 | 4,230 | 3,934 | 3,921 | 3,605 | 3,840 | 4,400 | 4,397 | 4,701 |
| 1999 | 5,065 | 4,575 | 3,962 | 3,709 | 3,802 | 3,684 | 3,516 | 3,938 | 3,982 | 4,063 | 3,946 | 3,891 |
| 2000 | 4,366 | 3,843 | 2,947 | 3,754 | 3,283 | 3,455 | 2,798 | 3,028 | 2,655 | 2,650 | 3,333 | 3,103 |
| 2001 | 3,770 | 3,842 | 3,821 | 3,234 | 2,721 | 3,121 | 3,228 | 3,134 | 3,853 | 3,722 | 3,748 | 4,335 |
| 2002 | 3,645 | 3,417 | 3,159 | 3,298 | 3,127 | 3,438 | 3,107 | 3,330 | 3,391 | 3,397 | 3,348 | 3,601 |
| 2003 | 3,065 | 2,698 | 3,051 | 2,884 | 3,332 | 3,372 | 3,163 | 3,973 | 4,045 | 3,573 | 4,126 | 3,455 |
| 2004 | 3,858 | 4,063 | 4,068 | 3,979 | 4,709 | 4,646 | 4,092 | 4,094 | 4,260 | 4,118 | 4,461 | 4,462 |
| 2005 | 4,590 | 4,090 | 4,182 | 3,928 | 4,406 | 4,219 | 3,873 | 3,718 | 4,012 | 3,680 | 3,912 | 3,971 |
| 2006 | 4,129 | 4,383 | 4,008 | 3,599 | 4,271 | 4,313 | 3,917 | 3,999 | 3,616 | 3,486 | 3,284 | 3,411 |
| 2007 | 3,917 | 3,977 | 3,648 | 3,310 | 3,087 | 4,793 | 3,919 | 4,108 | 4,041 | 3,612 | 3,707 | 3,505 |
| 2008 | 4,084 | 3,468 | 3,765 | 3,124 | 3,109 | 2,764 | 3,089 | 2,309 | 2,733 | 2,742 | 2,885 | 2,485 |
| 2009 | 2,428 | 2,046 | 2,553 | 2,345 | 1,986 | 2,155 | 2,202 | 2,369 | 2,419 | 2,275 | 2,063 | 2,254 |
| 2010 | 2,602 | 2,431 | 2,429 | 2,425 | 2,468 | 2,474 | 2,438 | 3,098 | 2,849 | 2,153 | 2,266 | 1,992 |
| 2011 | 2,218 | 1,918 | 1,859 | 1,962 | 1,939 | 1,812 | 1,875 | 1,762 | 1,970 | 2,127 | 2,139 | 1,990 |
| 2012 | 1,964 | 2,320 | 2,019 | 1,661 | 1,768 | 2,127 | 2,149 | 1,761 | 1,759 | 1,943 | 2,139 | 2,007 |
| 2013 | 1,565 | 1,482 | 1,482 | 1,731 | 1,712 | 1,867 | 1,715 | 1,685 | 1,626 | 1,640 | 1,608 | 1,691 |
| 2014 | 1,732 | 1,554 | 1,056 | 1,104 | 1,162 | 1,187 | 1,025 | 1,105 | 1,251 | 1,142 | 1,194 | 1,179 |
| 2015 | 1,304 | 1,196 | 1,105 | 1,056 | 1,061 | 1,126 | 1,136 | 1,156 | 1,213 | 1,228 | 1,118 | 1,066 |
| 2016 | 1,152 | 1,155 | 1,322 | 1,132 | 1,191 | 1,196 | 1,238 | 1,120 | 1,297 | 1,232 | 1,559 | 1,331 |
| 2017 | 1,269 | 1,210 | 1,168 | 1,157 | 1,163 | 1,119 | 1,081 | 983 | 1,340 | 1,294 | 1,207 | 1,189 |
| 2018 | 1,282 | 1,252 | 1,068 | 1,171 | 1,327 | 1,273 | 1,168 | 1,134 | 1,410 | 1,182 | 1,235 | 1,241 |
| 2019 | 1,438 | 1,443 | 1,261 | 1,374 | 1,615 | 1,546 | 1,566 | 1,266 | 1,317 | 1,645 | 1,899 | 1,538 |
| 2020 | 1,710 | 1,532 | 1,675 | 1,498 | 1,616 | 1,580 | 1,695 | 1,820 | 1,781 | 2,023 | 2,053 | 2,072 |
| 2021 | 1,864 | 1,802 | 1,384 | 1,533 | 1,592 | 1,498 | 1,652 | 1,392 | 1,208 | 1,415 | 1,276 | 1,196 |
| 2022 | 1,329 | 1,454 | 1,188 | 1,401 | 1,298 | 1,088 | 1,370 | 1,285 | 1,101 | 1,444 | 1,305 | 1,443 |
| 2023 | 1,223 | 1,294 | 1,291 | 1,223 | 1,185 | 1,268 | 1,052 | 1,246 | 1,459 | 1,380 | 1,084 | 1,033 |
| 2024 | 1,113 | |||||||||||
| - = No Data Reported; -- = Not Applicable; NA = Not Available; W = Withheld to avoid disclosure of individual company data. |
| Release Date: 3/29/2024 |
| Next Release Date: 4/30/2024 |