|
Download Data (XLS File) |
|
||||||||
|
||||||||
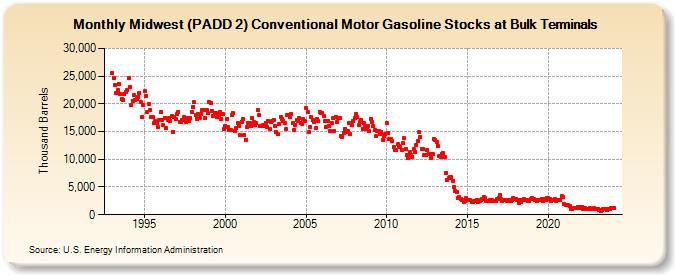
| Midwest (PADD 2) Conventional Motor Gasoline Stocks at Bulk Terminals (Thousand Barrels) | ||||||||
| Year | Jan | Feb | Mar | Apr | May | Jun | Jul | Aug | Sep | Oct | Nov | Dec |
|---|---|---|---|---|---|---|---|---|---|---|---|---|
| 1993 | 25,592 | 24,739 | 23,308 | 21,894 | 22,454 | 23,553 | 21,738 | 20,787 | 20,655 | 21,693 | 22,144 | 22,415 |
| 1994 | 24,619 | 23,043 | 19,832 | 20,561 | 21,503 | 20,759 | 20,895 | 21,286 | 22,014 | 20,273 | 17,638 | 19,792 |
| 1995 | 22,253 | 21,330 | 18,611 | 19,952 | 18,931 | 17,649 | 17,689 | 16,508 | 16,818 | 16,490 | 15,894 | 16,996 |
| 1996 | 18,518 | 17,164 | 16,208 | 17,401 | 15,685 | 17,023 | 17,424 | 16,931 | 17,885 | 14,990 | 17,589 | 17,215 |
| 1997 | 18,149 | 18,586 | 16,752 | 16,773 | 17,040 | 17,563 | 17,120 | 16,712 | 17,400 | 16,846 | 17,407 | 18,488 |
| 1998 | 19,495 | 20,241 | 17,929 | 17,299 | 18,099 | 17,391 | 18,237 | 18,917 | 18,803 | 17,366 | 18,879 | 18,271 |
| 1999 | 20,368 | 20,224 | 18,620 | 17,878 | 18,400 | 18,421 | 17,606 | 17,926 | 18,562 | 17,354 | 18,197 | 15,545 |
| 2000 | 16,051 | 17,347 | 15,850 | 15,320 | 15,340 | 17,955 | 18,260 | 15,061 | 15,568 | 16,556 | 15,968 | 14,349 |
| 2001 | 16,784 | 17,337 | 14,455 | 13,550 | 15,851 | 16,585 | 16,535 | 16,048 | 17,411 | 16,658 | 16,113 | 16,542 |
| 2002 | 18,887 | 17,955 | 16,087 | 16,006 | 16,139 | 15,958 | 16,573 | 15,796 | 16,852 | 15,405 | 16,696 | 16,987 |
| 2003 | 17,039 | 15,987 | 14,959 | 14,551 | 16,375 | 17,627 | 17,181 | 16,898 | 16,505 | 15,477 | 18,059 | 18,075 |
| 2004 | 17,576 | 18,214 | 16,473 | 15,212 | 16,149 | 17,084 | 16,915 | 17,369 | 16,526 | 16,361 | 17,248 | 16,851 |
| 2005 | 19,248 | 18,446 | 14,896 | 15,824 | 17,632 | 17,112 | 16,674 | 15,589 | 17,287 | 16,943 | 18,592 | 18,272 |
| 2006 | 18,325 | 17,749 | 16,987 | 15,859 | 16,875 | 16,014 | 15,143 | 16,550 | 17,429 | 15,130 | 17,649 | 16,805 |
| 2007 | 17,520 | 17,377 | 14,196 | 14,095 | 14,743 | 15,466 | 14,991 | 15,012 | 16,535 | 14,581 | 16,107 | 16,941 |
| 2008 | 17,496 | 18,225 | 17,607 | 16,140 | 16,642 | 17,108 | 15,446 | 16,476 | 15,761 | 15,429 | 16,042 | 15,164 |
| 2009 | 17,334 | 16,712 | 15,912 | 15,254 | 14,142 | 15,047 | 15,037 | 14,623 | 14,894 | 13,413 | 14,234 | 14,591 |
| 2010 | 16,519 | 14,825 | 13,708 | 13,576 | 13,288 | 12,282 | 11,605 | 11,648 | 12,753 | 12,320 | 12,203 | 11,688 |
| 2011 | 12,893 | 13,799 | 11,905 | 10,801 | 10,253 | 11,324 | 10,710 | 10,487 | 11,823 | 11,361 | 12,660 | 13,240 |
| 2012 | 14,936 | 14,050 | 11,929 | 11,818 | 10,700 | 10,805 | 11,682 | 11,002 | 10,975 | 10,313 | 11,030 | 13,631 |
| 2013 | 13,470 | 13,197 | 12,366 | 10,652 | 10,403 | 11,010 | 11,049 | 10,393 | 7,483 | 6,333 | 6,538 | 6,755 |
| 2014 | 6,714 | 6,135 | 4,946 | 4,201 | 4,110 | 3,072 | 3,130 | 2,835 | 2,596 | 2,348 | 2,404 | 3,054 |
| 2015 | 2,694 | 2,687 | 2,566 | 2,339 | 2,204 | 2,475 | 2,551 | 2,700 | 2,380 | 2,455 | 2,628 | 2,907 |
| 2016 | 3,241 | 3,072 | 2,563 | 2,475 | 2,428 | 2,587 | 2,587 | 2,501 | 2,551 | 2,438 | 2,901 | 2,984 |
| 2017 | 3,510 | 2,761 | 2,515 | 2,574 | 2,572 | 2,469 | 2,635 | 2,647 | 2,463 | 2,716 | 2,979 | 2,867 |
| 2018 | 2,747 | 2,670 | 2,181 | 2,594 | 2,251 | 2,649 | 2,782 | 2,568 | 2,570 | 2,399 | 2,451 | 2,882 |
| 2019 | 3,025 | 2,797 | 2,643 | 2,653 | 2,428 | 2,598 | 2,621 | 2,837 | 2,425 | 2,786 | 2,636 | 3,032 |
| 2020 | 3,021 | 2,770 | 2,515 | 2,649 | 2,736 | 2,839 | 2,436 | 2,663 | 2,708 | 2,733 | 3,313 | 3,282 |
| 2021 | 1,905 | 1,725 | 1,738 | 1,666 | 1,530 | 1,033 | 1,106 | 1,213 | 1,143 | 1,193 | 1,347 | 1,186 |
| 2022 | 1,384 | 1,417 | 1,106 | 1,174 | 1,052 | 1,078 | 1,050 | 1,125 | 949 | 1,059 | 1,121 | 1,008 |
| 2023 | 1,056 | 1,084 | 774 | 703 | 916 | 965 | 1,075 | 982 | 890 | 1,049 | 1,047 | 1,121 |
| 2024 | 1,253 | |||||||||||
| - = No Data Reported; -- = Not Applicable; NA = Not Available; W = Withheld to avoid disclosure of individual company data. |
| Release Date: 3/29/2024 |
| Next Release Date: 4/30/2024 |