|
Download Data (XLS File) |
|
||||||||
|
||||||||
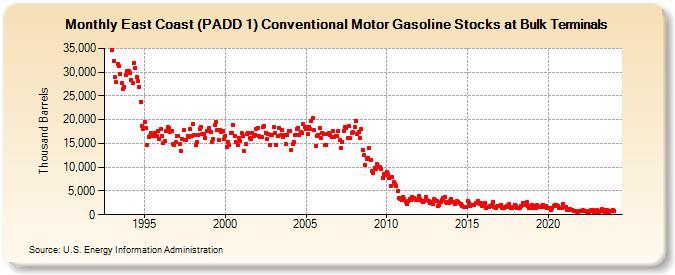
| East Coast (PADD 1) Conventional Motor Gasoline Stocks at Bulk Terminals (Thousand Barrels) | ||||||||
| Year | Jan | Feb | Mar | Apr | May | Jun | Jul | Aug | Sep | Oct | Nov | Dec |
|---|---|---|---|---|---|---|---|---|---|---|---|---|
| 1993 | 34,613 | 32,250 | 28,974 | 27,977 | 31,651 | 31,334 | 29,599 | 27,819 | 26,481 | 26,912 | 29,461 | 30,199 |
| 1994 | 30,184 | 29,918 | 28,393 | 27,632 | 31,999 | 30,958 | 28,998 | 28,125 | 26,946 | 23,685 | 18,735 | 18,106 |
| 1995 | 19,477 | 18,170 | 14,760 | 16,361 | 16,498 | 17,094 | 16,515 | 16,912 | 17,240 | 16,634 | 17,533 | 15,853 |
| 1996 | 18,075 | 16,562 | 15,052 | 15,463 | 17,521 | 18,391 | 18,328 | 17,415 | 17,588 | 14,915 | 14,704 | 15,207 |
| 1997 | 16,620 | 16,629 | 14,926 | 13,458 | 15,972 | 17,863 | 15,824 | 15,628 | 16,515 | 16,262 | 18,013 | 16,557 |
| 1998 | 19,154 | 16,865 | 14,631 | 15,271 | 16,786 | 18,030 | 18,519 | 16,998 | 16,965 | 16,246 | 17,661 | 17,635 |
| 1999 | 18,228 | 17,440 | 15,402 | 15,934 | 18,951 | 19,523 | 17,837 | 15,621 | 17,896 | 17,319 | 17,605 | 15,967 |
| 2000 | 16,594 | 14,322 | 15,394 | 14,659 | 17,276 | 17,283 | 18,837 | 16,544 | 15,223 | 14,669 | 16,149 | 15,468 |
| 2001 | 17,224 | 16,559 | 13,324 | 14,953 | 17,054 | 17,244 | 16,130 | 15,950 | 17,276 | 16,662 | 16,816 | 18,029 |
| 2002 | 18,255 | 16,466 | 16,293 | 16,413 | 18,480 | 18,674 | 17,276 | 15,878 | 16,886 | 14,752 | 16,754 | 16,861 |
| 2003 | 18,384 | 17,152 | 14,650 | 16,655 | 18,306 | 16,699 | 17,864 | 16,319 | 16,787 | 14,920 | 16,762 | 17,590 |
| 2004 | 17,544 | 13,721 | 14,924 | 15,253 | 16,791 | 18,079 | 18,332 | 16,770 | 17,457 | 17,246 | 19,019 | 18,438 |
| 2005 | 17,986 | 16,995 | 18,401 | 18,031 | 19,797 | 20,323 | 17,852 | 14,542 | 16,573 | 16,860 | 18,145 | 16,041 |
| 2006 | 17,295 | 16,982 | 14,593 | 14,762 | 17,019 | 17,172 | 16,692 | 16,289 | 17,512 | 16,391 | 16,556 | 16,599 |
| 2007 | 17,546 | 15,669 | 14,138 | 15,306 | 17,713 | 18,473 | 18,286 | 16,149 | 18,667 | 16,078 | 17,286 | 17,403 |
| 2008 | 18,527 | 19,751 | 16,894 | 17,471 | 16,234 | 18,026 | 13,708 | 12,547 | 10,502 | 11,656 | 11,901 | 14,051 |
| 2009 | 11,524 | 9,138 | 8,820 | 9,738 | 9,570 | 10,613 | 10,026 | 10,028 | 9,604 | 7,810 | 8,668 | 8,401 |
| 2010 | 9,069 | 8,479 | 7,654 | 6,080 | 7,865 | 6,818 | 6,443 | 6,105 | 4,993 | 3,523 | 3,376 | 3,164 |
| 2011 | 3,729 | 3,269 | 2,573 | 2,161 | 2,949 | 3,270 | 2,993 | 3,690 | 3,479 | 3,261 | 3,166 | 3,094 |
| 2012 | 3,876 | 3,300 | 2,946 | 2,623 | 2,899 | 3,760 | 3,004 | 2,806 | 2,556 | 2,655 | 2,353 | 3,272 |
| 2013 | 3,098 | 2,899 | 1,929 | 2,111 | 2,644 | 3,016 | 3,414 | 3,667 | 2,737 | 2,508 | 2,485 | 2,953 |
| 2014 | 3,332 | 2,699 | 2,685 | 2,260 | 2,903 | 2,672 | 2,469 | 2,323 | 1,890 | 1,694 | 1,549 | 1,717 |
| 2015 | 2,905 | 2,515 | 1,832 | 1,949 | 1,981 | 2,005 | 2,523 | 2,517 | 2,933 | 2,328 | 2,373 | 1,854 |
| 2016 | 2,167 | 2,467 | 1,467 | 1,536 | 1,523 | 1,912 | 2,030 | 2,727 | 1,532 | 1,395 | 1,787 | 1,781 |
| 2017 | 1,784 | 2,147 | 1,422 | 1,507 | 1,698 | 1,740 | 1,521 | 2,169 | 1,328 | 1,328 | 1,603 | 1,996 |
| 2018 | 1,892 | 1,362 | 1,338 | 1,323 | 1,938 | 2,474 | 1,998 | 2,175 | 2,591 | 1,755 | 1,383 | 1,455 |
| 2019 | 2,107 | 1,802 | 1,474 | 1,384 | 1,963 | 1,598 | 1,642 | 1,938 | 2,136 | 1,598 | 1,886 | 1,490 |
| 2020 | 1,328 | 1,471 | 1,096 | 1,391 | 1,838 | 1,983 | 2,050 | 1,809 | 1,460 | 1,491 | 1,434 | 2,328 |
| 2021 | 1,583 | 1,709 | 1,049 | 1,025 | 1,267 | 1,043 | 1,059 | 836 | 847 | 618 | 656 | 716 |
| 2022 | 758 | 692 | 921 | 771 | 830 | 623 | 613 | 777 | 915 | 903 | 608 | 521 |
| 2023 | 939 | 690 | 448 | 687 | 1,098 | 766 | 670 | 1,052 | 924 | 592 | 705 | 697 |
| 2024 | 1,064 | |||||||||||
| - = No Data Reported; -- = Not Applicable; NA = Not Available; W = Withheld to avoid disclosure of individual company data. |
| Release Date: 3/29/2024 |
| Next Release Date: 4/30/2024 |