|
Download Data (XLS File) |
|
||||||||
|
||||||||
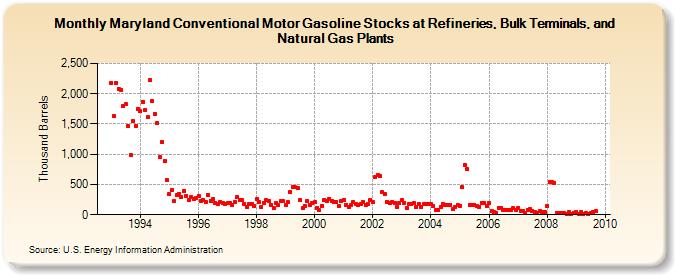
| Maryland Conventional Motor Gasoline Stocks at Refineries, Bulk Terminals, and Natural Gas Plants (Thousand Barrels) | ||||||||
| Year | Jan | Feb | Mar | Apr | May | Jun | Jul | Aug | Sep | Oct | Nov | Dec |
|---|---|---|---|---|---|---|---|---|---|---|---|---|
| 1993 | 2,179 | 1,634 | 2,174 | 2,085 | 2,069 | 1,794 | 1,824 | 1,459 | 991 | 1,543 | 1,464 | 1,746 |
| 1994 | 1,708 | 1,868 | 1,730 | 1,612 | 2,223 | 1,878 | 1,670 | 1,516 | 946 | 1,202 | 885 | 567 |
| 1995 | 342 | 412 | 219 | 320 | 350 | 286 | 390 | 316 | 239 | 295 | 266 | 278 |
| 1996 | 312 | 233 | 246 | 210 | 326 | 234 | 262 | 191 | 183 | 208 | 200 | 181 |
| 1997 | 197 | 195 | 161 | 212 | 296 | 239 | 236 | 178 | 124 | 182 | 173 | 140 |
| 1998 | 259 | 213 | 129 | 200 | 239 | 232 | 166 | 114 | 187 | 155 | 232 | 226 |
| 1999 | 158 | 206 | 377 | 459 | 450 | 439 | 236 | 107 | 152 | 227 | 168 | 191 |
| 2000 | 204 | 119 | 71 | 149 | 240 | 224 | 266 | 234 | 214 | 208 | 136 | 232 |
| 2001 | 242 | 168 | 128 | 153 | 212 | 181 | 164 | 185 | 208 | 168 | 171 | 243 |
| 2002 | 206 | 619 | 659 | 636 | 368 | 335 | 216 | 191 | 214 | 198 | 128 | 201 |
| 2003 | 236 | 200 | 105 | 179 | 171 | 186 | 134 | 181 | 122 | 174 | 171 | 175 |
| 2004 | 172 | 142 | 70 | 72 | 131 | 182 | 154 | 168 | 167 | 88 | 132 | 157 |
| 2005 | 149 | 452 | 818 | 749 | 153 | 156 | 168 | 148 | 135 | 198 | 194 | 145 |
| 2006 | 194 | 65 | 53 | 35 | 117 | 106 | 74 | 82 | 79 | 73 | 109 | 83 |
| 2007 | 116 | 68 | 62 | 36 | 83 | 88 | 59 | 43 | 32 | 56 | 48 | 50 |
| 2008 | 140 | 540 | 542 | 521 | 34 | 32 | 25 | 22 | 7 | 44 | 14 | 31 |
| 2009 | 45 | 9 | 37 | 7 | 33 | 17 | 27 | 41 | 60 | |||
| - = No Data Reported; -- = Not Applicable; NA = Not Available; W = Withheld to avoid disclosure of individual company data. |
| Release Date: 3/29/2024 |
| Next Release Date: 4/30/2024 |