|
Download Data (XLS File) |
|
||||||||
|
||||||||
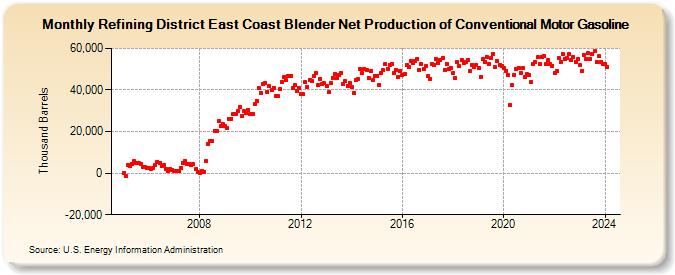
| Refining District East Coast Blender Net Production of Conventional Motor Gasoline (Thousand Barrels) | ||||||||
| Year | Jan | Feb | Mar | Apr | May | Jun | Jul | Aug | Sep | Oct | Nov | Dec |
|---|---|---|---|---|---|---|---|---|---|---|---|---|
| 2005 | 134 | -1,440 | 4,130 | 3,548 | 4,543 | 5,680 | 4,903 | 4,796 | 4,610 | 3,053 | 2,877 | 2,339 |
| 2006 | 2,321 | 1,788 | 2,307 | 3,934 | 5,388 | 5,098 | 3,462 | 3,924 | 2,166 | 803 | 1,799 | 1,639 |
| 2007 | 1,162 | 885 | 810 | 2,439 | 5,047 | 6,008 | 4,519 | 4,510 | 3,739 | 4,224 | 2,014 | 607 |
| 2008 | 235 | 1,095 | 311 | 5,680 | 14,182 | 15,292 | 15,243 | 20,474 | 20,027 | 24,932 | 22,589 | 23,615 |
| 2009 | 22,447 | 21,613 | 26,171 | 26,199 | 28,236 | 28,276 | 29,660 | 31,825 | 27,573 | 29,696 | 28,776 | 30,490 |
| 2010 | 28,269 | 28,361 | 33,225 | 34,870 | 40,877 | 38,641 | 42,696 | 43,413 | 38,968 | 41,731 | 39,810 | 41,069 |
| 2011 | 36,951 | 37,067 | 40,279 | 44,002 | 46,334 | 44,601 | 46,605 | 46,818 | 41,110 | 42,341 | 39,466 | 41,089 |
| 2012 | 37,963 | 37,842 | 43,739 | 41,660 | 44,968 | 44,246 | 46,588 | 48,183 | 42,262 | 45,426 | 42,878 | 43,119 |
| 2013 | 41,682 | 38,828 | 43,434 | 45,978 | 47,858 | 45,623 | 47,097 | 48,084 | 43,015 | 44,252 | 42,073 | 43,550 |
| 2014 | 41,209 | 38,739 | 44,704 | 45,095 | 49,898 | 48,172 | 50,091 | 49,713 | 45,669 | 48,955 | 44,630 | 46,931 |
| 2015 | 46,918 | 42,562 | 48,118 | 49,719 | 52,444 | 50,039 | 52,242 | 52,431 | 48,158 | 49,746 | 46,477 | 49,261 |
| 2016 | 47,412 | 47,632 | 52,019 | 50,838 | 54,071 | 52,848 | 53,999 | 55,070 | 49,671 | 52,490 | 49,880 | 51,313 |
| 2017 | 46,717 | 45,453 | 52,270 | 52,025 | 55,071 | 52,856 | 54,293 | 55,413 | 49,784 | 52,667 | 50,112 | 50,675 |
| 2018 | 47,929 | 45,863 | 53,327 | 51,538 | 54,478 | 53,201 | 53,290 | 54,419 | 48,904 | 52,208 | 51,011 | 51,898 |
| 2019 | 50,626 | 46,220 | 54,667 | 53,357 | 55,940 | 52,613 | 55,409 | 57,351 | 50,843 | 53,837 | 51,956 | 51,647 |
| 2020 | 50,687 | 49,340 | 47,223 | 32,713 | 42,466 | 47,349 | 50,116 | 50,743 | 48,094 | 50,464 | 46,183 | 47,472 |
| 2021 | 47,145 | 43,766 | 52,632 | 53,419 | 55,637 | 52,555 | 55,902 | 56,147 | 52,659 | 54,341 | 52,273 | 51,674 |
| 2022 | 48,246 | 48,892 | 55,253 | 53,436 | 57,220 | 54,700 | 55,542 | 57,409 | 54,220 | 55,709 | 53,414 | 54,826 |
| 2023 | 51,878 | 49,179 | 56,908 | 55,002 | 57,557 | 54,705 | 57,127 | 58,531 | 53,393 | 56,189 | 53,659 | 52,485 |
| 2024 | 52,280 | |||||||||||
| - = No Data Reported; -- = Not Applicable; NA = Not Available; W = Withheld to avoid disclosure of individual company data. |
| Release Date: 3/29/2024 |
| Next Release Date: 4/30/2024 |