|
Download Data (XLS File) |
|
||||||||
|
||||||||
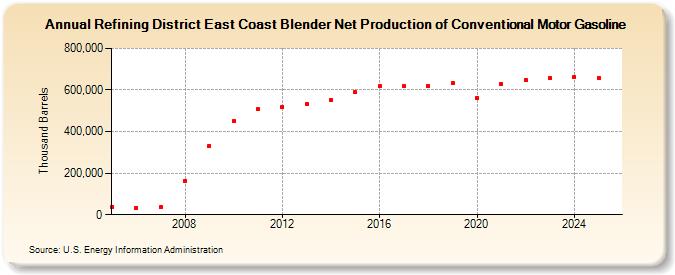
| Refining District East Coast Blender Net Production of Conventional Motor Gasoline (Thousand Barrels) | ||||||||
| Decade | Year-0 | Year-1 | Year-2 | Year-3 | Year-4 | Year-5 | Year-6 | Year-7 | Year-8 | Year-9 |
|---|---|---|---|---|---|---|---|---|---|---|
| 2000's | 39,173 | 34,629 | 35,964 | 163,675 | 330,962 | |||||
| 2010's | 451,930 | 506,663 | 518,874 | 531,474 | 553,806 | 588,115 | 617,243 | 617,336 | 618,066 | 634,466 |
| 2020's | 562,850 | 628,150 | 648,867 | 656,613 |
| - = No Data Reported; -- = Not Applicable; NA = Not Available; W = Withheld to avoid disclosure of individual company data. |
| Release Date: 3/29/2024 |
| Next Release Date: 8/30/2024 |