|
Download Data (XLS File) |
|
||||||||
|
||||||||
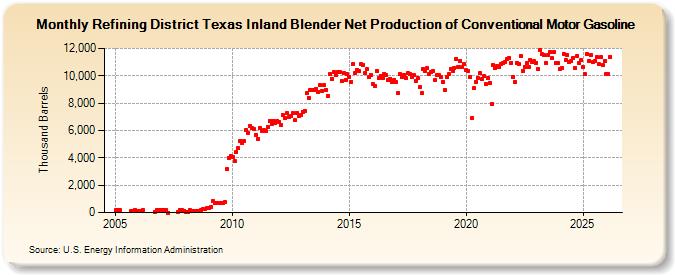
| Refining District Texas Inland Blender Net Production of Conventional Motor Gasoline (Thousand Barrels) | ||||||||
| Year | Jan | Feb | Mar | Apr | May | Jun | Jul | Aug | Sep | Oct | Nov | Dec |
|---|---|---|---|---|---|---|---|---|---|---|---|---|
| 2005 | 193 | 175 | 181 | 82 | 150 | 191 | 108 | |||||
| 2006 | 148 | 100 | 154 | 76 | 178 | 174 | 171 | |||||
| 2007 | 167 | 165 | 172 | 1 | 74 | 174 | 163 | 137 | ||||
| 2008 | 77 | 44 | 156 | 102 | 122 | 147 | 122 | 88 | 181 | 292 | 275 | 305 |
| 2009 | 325 | 381 | 824 | 678 | 698 | 684 | 702 | 728 | 784 | 3,162 | 3,978 | 4,142 |
| 2010 | 4,059 | 3,776 | 4,426 | 4,695 | 5,256 | 5,048 | 5,214 | 6,055 | 5,804 | 6,337 | 6,146 | 6,089 |
| 2011 | 5,696 | 5,406 | 6,167 | 5,998 | 6,031 | 5,956 | 6,259 | 6,707 | 6,474 | 6,729 | 6,535 | 6,711 |
| 2012 | 6,632 | 6,407 | 7,097 | 6,889 | 7,275 | 7,008 | 7,070 | 7,256 | 6,734 | 7,305 | 7,071 | 7,166 |
| 2013 | 7,372 | 7,449 | 8,705 | 8,402 | 8,949 | 8,975 | 8,947 | 9,047 | 8,838 | 9,315 | 8,912 | 9,313 |
| 2014 | 8,978 | 8,524 | 10,096 | 9,782 | 10,271 | 10,019 | 10,287 | 10,276 | 9,617 | 10,190 | 9,695 | 10,096 |
| 2015 | 9,928 | 9,565 | 10,866 | 10,228 | 10,440 | 10,355 | 10,828 | 10,806 | 10,214 | 10,470 | 9,918 | 10,038 |
| 2016 | 9,406 | 9,282 | 10,351 | 9,812 | 10,018 | 9,846 | 10,161 | 10,091 | 9,677 | 9,794 | 9,521 | 9,724 |
| 2017 | 9,509 | 8,731 | 10,092 | 9,911 | 10,048 | 9,846 | 10,187 | 10,154 | 9,890 | 10,034 | 9,646 | 9,846 |
| 2018 | 9,160 | 8,708 | 10,460 | 10,323 | 10,535 | 10,094 | 10,253 | 10,359 | 9,687 | 10,076 | 10,051 | 9,922 |
| 2019 | 9,577 | 8,960 | 9,924 | 10,117 | 10,505 | 10,350 | 10,565 | 11,219 | 10,673 | 11,097 | 10,619 | 10,834 |
| 2020 | 10,393 | 10,332 | 9,942 | 6,923 | 9,081 | 9,549 | 9,849 | 10,173 | 9,749 | 9,956 | 9,414 | 9,826 |
| 2021 | 9,472 | 7,971 | 10,754 | 10,584 | 10,704 | 10,635 | 10,882 | 10,905 | 11,004 | 11,220 | 11,299 | 10,959 |
| 2022 | 9,920 | 9,538 | 10,966 | 10,885 | 11,468 | 10,382 | 10,673 | 10,901 | 10,650 | 11,180 | 10,978 | 11,051 |
| 2023 | 10,871 | 10,361 | 11,860 | 11,559 | 11,486 | 11,069 | 11,494 | 11,735 | 11,310 | 11,756 | 10,947 | 10,824 |
| 2024 | 10,482 | |||||||||||
| - = No Data Reported; -- = Not Applicable; NA = Not Available; W = Withheld to avoid disclosure of individual company data. |
| Release Date: 3/29/2024 |
| Next Release Date: 4/30/2024 |