|
Download Data (XLS File) |
|
||||||||
|
||||||||
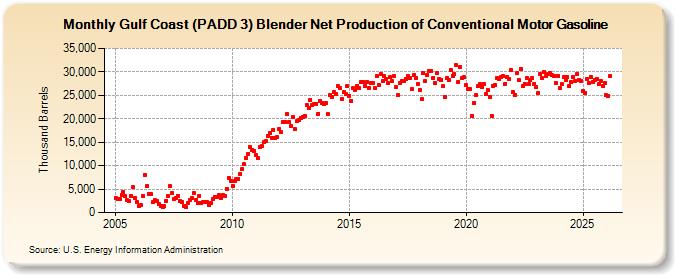
| Gulf Coast (PADD 3) Blender Net Production of Conventional Motor Gasoline (Thousand Barrels) | ||||||||
| Year | Jan | Feb | Mar | Apr | May | Jun | Jul | Aug | Sep | Oct | Nov | Dec |
|---|---|---|---|---|---|---|---|---|---|---|---|---|
| 2005 | 3,140 | 2,907 | 2,928 | 3,837 | 4,414 | 3,439 | 2,623 | 2,504 | 3,538 | 5,393 | 3,036 | 2,180 |
| 2006 | 1,413 | 1,513 | 3,599 | 8,105 | 5,591 | 4,019 | 3,900 | 2,172 | 2,592 | 2,454 | 1,725 | 1,482 |
| 2007 | 1,289 | 1,331 | 2,562 | 3,484 | 5,626 | 4,242 | 2,900 | 3,068 | 3,591 | 2,471 | 2,294 | 1,425 |
| 2008 | 1,146 | 2,053 | 2,644 | 3,106 | 4,174 | 2,758 | 2,128 | 3,596 | 2,114 | 2,251 | 2,236 | 2,219 |
| 2009 | 1,655 | 2,059 | 2,944 | 3,213 | 3,272 | 3,660 | 3,143 | 3,638 | 3,587 | 5,106 | 7,330 | 6,683 |
| 2010 | 5,676 | 6,711 | 7,256 | 7,190 | 8,242 | 9,335 | 10,278 | 11,659 | 12,578 | 13,876 | 13,343 | 13,142 |
| 2011 | 12,286 | 11,636 | 13,951 | 14,088 | 14,972 | 15,176 | 16,341 | 16,945 | 15,992 | 17,610 | 15,936 | 16,007 |
| 2012 | 17,763 | 17,089 | 19,405 | 19,354 | 20,981 | 19,278 | 18,483 | 20,285 | 17,743 | 19,446 | 19,766 | 20,145 |
| 2013 | 20,374 | 20,690 | 22,885 | 22,278 | 24,070 | 22,931 | 23,133 | 23,230 | 21,115 | 23,833 | 23,415 | 23,212 |
| 2014 | 23,308 | 20,991 | 24,961 | 24,590 | 25,798 | 25,325 | 26,954 | 26,605 | 24,280 | 25,645 | 25,231 | 26,959 |
| 2015 | 24,927 | 23,826 | 26,488 | 26,234 | 27,028 | 26,503 | 27,921 | 27,927 | 26,917 | 27,915 | 26,504 | 27,638 |
| 2016 | 27,681 | 26,582 | 29,090 | 27,289 | 29,513 | 28,061 | 29,102 | 28,553 | 27,525 | 28,826 | 27,950 | 29,101 |
| 2017 | 26,775 | 24,997 | 27,585 | 28,079 | 28,064 | 28,412 | 29,089 | 28,665 | 26,294 | 29,327 | 28,746 | 27,496 |
| 2018 | 26,122 | 24,140 | 29,712 | 28,005 | 29,301 | 30,150 | 30,223 | 28,781 | 27,578 | 29,852 | 28,453 | 28,263 |
| 2019 | 26,889 | 24,717 | 28,625 | 28,234 | 30,400 | 29,188 | 29,511 | 31,375 | 27,842 | 30,982 | 28,670 | 28,816 |
| 2020 | 27,128 | 26,448 | 26,299 | 20,501 | 23,408 | 24,986 | 26,904 | 27,324 | 26,778 | 27,414 | 25,310 | 26,080 |
| 2021 | 24,626 | 20,621 | 27,078 | 27,160 | 28,739 | 28,480 | 28,939 | 29,019 | 27,491 | 28,867 | 28,554 | 30,380 |
| 2022 | 25,805 | 25,049 | 29,673 | 28,323 | 30,645 | 26,974 | 27,491 | 28,652 | 27,321 | 28,364 | 28,714 | 27,495 |
| 2023 | 26,670 | 25,437 | 29,595 | 28,660 | 30,060 | 29,191 | 29,508 | 29,733 | 29,259 | 29,220 | 27,653 | 29,045 |
| 2024 | 26,519 | |||||||||||
| - = No Data Reported; -- = Not Applicable; NA = Not Available; W = Withheld to avoid disclosure of individual company data. |
| Release Date: 3/29/2024 |
| Next Release Date: 4/30/2024 |