|
Download Data (XLS File) |
|
||||||||
|
||||||||
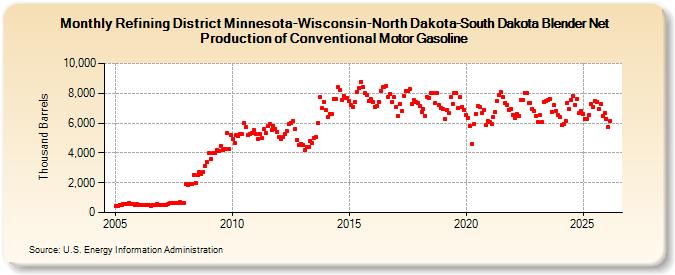
| Refining District Minnesota-Wisconsin-North Dakota-South Dakota Blender Net Production of Conventional Motor Gasoline (Thousand Barrels) | ||||||||
| Year | Jan | Feb | Mar | Apr | May | Jun | Jul | Aug | Sep | Oct | Nov | Dec |
|---|---|---|---|---|---|---|---|---|---|---|---|---|
| 2005 | 472 | 452 | 526 | 511 | 572 | 601 | 607 | 643 | 567 | 578 | 509 | 561 |
| 2006 | 504 | 478 | 486 | 514 | 533 | 488 | 454 | 525 | 506 | 562 | 538 | 512 |
| 2007 | 538 | 516 | 527 | 572 | 628 | 629 | 645 | 629 | 621 | 679 | 654 | 662 |
| 2008 | 1,892 | 1,833 | 1,906 | 1,931 | 2,523 | 2,002 | 2,493 | 2,720 | 2,558 | 2,737 | 3,115 | 3,376 |
| 2009 | 3,989 | 3,624 | 3,965 | 3,968 | 4,203 | 4,143 | 4,491 | 4,188 | 4,293 | 5,346 | 4,256 | 5,171 |
| 2010 | 4,946 | 4,669 | 5,200 | 5,117 | 5,288 | 5,240 | 6,008 | 5,741 | 5,221 | 5,291 | 5,322 | 5,554 |
| 2011 | 5,279 | 4,967 | 5,301 | 4,981 | 5,589 | 5,358 | 5,783 | 5,938 | 5,519 | 5,832 | 5,586 | 5,421 |
| 2012 | 5,097 | 4,912 | 5,046 | 5,242 | 5,479 | 5,931 | 6,032 | 6,156 | 5,635 | 4,867 | 4,543 | 4,629 |
| 2013 | 4,527 | 4,202 | 4,431 | 4,386 | 4,817 | 4,659 | 4,999 | 5,060 | 6,014 | 7,771 | 6,986 | 7,449 |
| 2014 | 6,867 | 6,389 | 6,629 | 6,582 | 7,607 | 7,622 | 8,394 | 8,240 | 7,547 | 7,849 | 7,715 | 7,670 |
| 2015 | 7,514 | 7,195 | 7,107 | 7,415 | 8,113 | 8,358 | 8,791 | 8,425 | 7,998 | 7,872 | 7,451 | 7,635 |
| 2016 | 7,417 | 7,100 | 7,156 | 7,421 | 8,166 | 8,401 | 8,396 | 8,515 | 7,725 | 7,965 | 7,445 | 7,745 |
| 2017 | 7,060 | 6,466 | 7,271 | 6,810 | 7,839 | 8,128 | 8,185 | 8,261 | 7,308 | 7,554 | 7,416 | 7,362 |
| 2018 | 7,171 | 6,715 | 6,944 | 6,485 | 7,753 | 7,703 | 8,021 | 7,987 | 7,362 | 8,016 | 7,196 | 7,010 |
| 2019 | 6,923 | 6,304 | 6,890 | 6,698 | 7,740 | 7,310 | 8,002 | 8,018 | 6,985 | 7,759 | 7,090 | 6,869 |
| 2020 | 6,564 | 6,318 | 5,773 | 4,624 | 5,935 | 6,600 | 7,163 | 7,056 | 6,666 | 6,847 | 5,898 | 6,157 |
| 2021 | 6,069 | 5,931 | 6,427 | 6,754 | 7,493 | 7,885 | 8,093 | 7,722 | 7,367 | 7,205 | 6,893 | 6,951 |
| 2022 | 6,560 | 6,340 | 6,640 | 6,467 | 7,553 | 7,520 | 8,052 | 8,046 | 7,366 | 7,369 | 6,928 | 6,785 |
| 2023 | 6,464 | 6,080 | 6,527 | 6,046 | 7,424 | 7,477 | 7,517 | 7,645 | 6,760 | 7,187 | 6,838 | 6,543 |
| 2024 | 6,383 | |||||||||||
| - = No Data Reported; -- = Not Applicable; NA = Not Available; W = Withheld to avoid disclosure of individual company data. |
| Release Date: 3/29/2024 |
| Next Release Date: 4/30/2024 |