|
Download Data (XLS File) |
|
||||||||
|
||||||||
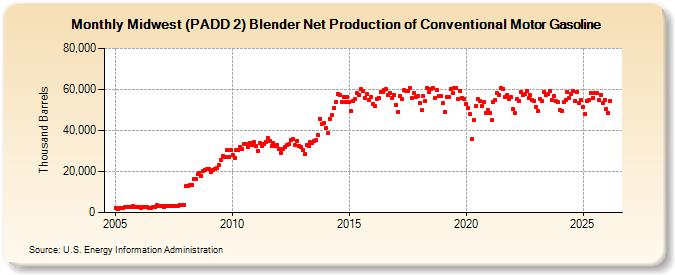
| Midwest (PADD 2) Blender Net Production of Conventional Motor Gasoline (Thousand Barrels) | ||||||||
| Year | Jan | Feb | Mar | Apr | May | Jun | Jul | Aug | Sep | Oct | Nov | Dec |
|---|---|---|---|---|---|---|---|---|---|---|---|---|
| 2005 | 2,041 | 1,911 | 2,210 | 2,203 | 2,450 | 2,597 | 2,719 | 2,829 | 2,810 | 2,989 | 2,604 | 2,803 |
| 2006 | 2,489 | 2,284 | 2,537 | 2,631 | 2,688 | 2,416 | 2,290 | 2,660 | 2,779 | 3,680 | 3,014 | 3,402 |
| 2007 | 3,149 | 2,874 | 3,097 | 3,054 | 3,027 | 3,163 | 3,262 | 3,366 | 3,432 | 3,884 | 3,795 | 3,813 |
| 2008 | 12,746 | 12,719 | 13,484 | 13,416 | 16,330 | 16,468 | 18,650 | 19,123 | 17,975 | 20,058 | 20,760 | 21,136 |
| 2009 | 21,064 | 19,682 | 20,599 | 21,439 | 21,943 | 22,998 | 25,516 | 27,683 | 27,063 | 30,245 | 27,169 | 30,473 |
| 2010 | 27,876 | 26,822 | 30,337 | 30,632 | 31,757 | 31,033 | 33,462 | 33,298 | 31,930 | 34,069 | 33,116 | 34,265 |
| 2011 | 32,261 | 30,074 | 33,764 | 32,235 | 33,415 | 34,436 | 36,349 | 35,099 | 32,353 | 33,752 | 32,561 | 33,004 |
| 2012 | 30,963 | 28,855 | 31,147 | 31,766 | 33,152 | 33,174 | 35,240 | 35,624 | 32,685 | 34,761 | 32,516 | 32,165 |
| 2013 | 30,259 | 28,357 | 32,895 | 32,547 | 34,241 | 33,748 | 34,650 | 35,220 | 37,666 | 45,747 | 43,243 | 43,721 |
| 2014 | 41,155 | 38,604 | 45,484 | 47,648 | 50,967 | 53,831 | 57,940 | 57,217 | 53,942 | 56,179 | 54,079 | 56,201 |
| 2015 | 53,864 | 49,495 | 54,422 | 55,244 | 58,269 | 57,376 | 60,151 | 59,017 | 56,012 | 57,914 | 54,701 | 56,189 |
| 2016 | 53,005 | 51,746 | 55,515 | 56,044 | 58,699 | 58,889 | 59,884 | 60,048 | 57,098 | 58,318 | 56,048 | 57,227 |
| 2017 | 52,655 | 49,161 | 56,979 | 55,132 | 59,493 | 59,309 | 59,299 | 60,863 | 55,769 | 58,041 | 56,255 | 56,977 |
| 2018 | 53,283 | 49,867 | 56,607 | 54,603 | 60,679 | 58,745 | 60,049 | 60,686 | 55,823 | 59,813 | 56,772 | 56,595 |
| 2019 | 53,216 | 49,104 | 56,314 | 56,175 | 60,372 | 58,031 | 60,696 | 60,615 | 55,317 | 59,309 | 55,833 | 55,552 |
| 2020 | 52,706 | 51,020 | 48,051 | 35,859 | 45,291 | 51,998 | 55,205 | 54,309 | 52,020 | 53,881 | 48,469 | 49,815 |
| 2021 | 48,466 | 44,958 | 54,020 | 54,634 | 58,193 | 57,504 | 60,653 | 60,383 | 56,496 | 57,290 | 55,346 | 56,074 |
| 2022 | 50,413 | 48,380 | 55,198 | 54,464 | 58,672 | 57,363 | 57,741 | 59,097 | 55,917 | 57,160 | 54,630 | 54,399 |
| 2023 | 51,286 | 49,323 | 55,139 | 54,299 | 58,784 | 57,467 | 57,599 | 59,214 | 54,717 | 56,662 | 54,238 | 53,703 |
| 2024 | 49,810 | |||||||||||
| - = No Data Reported; -- = Not Applicable; NA = Not Available; W = Withheld to avoid disclosure of individual company data. |
| Release Date: 3/29/2024 |
| Next Release Date: 4/30/2024 |