|
Download Data (XLS File) |
|
||||||||
|
||||||||
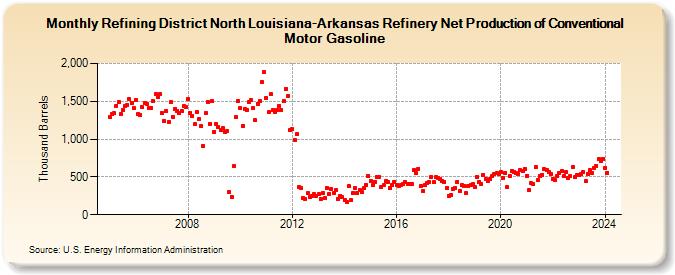
| Refining District North Louisiana-Arkansas Refinery Net Production of Conventional Motor Gasoline (Thousand Barrels) | ||||||||
| Year | Jan | Feb | Mar | Apr | May | Jun | Jul | Aug | Sep | Oct | Nov | Dec |
|---|---|---|---|---|---|---|---|---|---|---|---|---|
| 2005 | 1,296 | 1,328 | 1,339 | 1,441 | 1,492 | 1,327 | 1,390 | 1,442 | 1,454 | 1,525 | 1,482 | 1,405 |
| 2006 | 1,520 | 1,332 | 1,317 | 1,421 | 1,478 | 1,467 | 1,414 | 1,413 | 1,499 | 1,592 | 1,553 | 1,591 |
| 2007 | 1,347 | 1,241 | 1,375 | 1,228 | 1,485 | 1,298 | 1,402 | 1,375 | 1,345 | 1,374 | 1,432 | 1,424 |
| 2008 | 1,527 | 1,344 | 1,312 | 1,199 | 1,357 | 1,269 | 1,170 | 910 | 1,343 | 1,495 | 1,201 | 1,501 |
| 2009 | 1,100 | 1,200 | 1,159 | 1,124 | 1,141 | 1,094 | 1,101 | 296 | 237 | 638 | 1,286 | 1,502 |
| 2010 | 1,405 | 1,171 | 1,404 | 1,387 | 1,487 | 1,511 | 1,412 | 1,249 | 1,470 | 1,500 | 1,753 | 1,883 |
| 2011 | 1,545 | 1,354 | 1,591 | 1,390 | 1,356 | 1,384 | 1,438 | 1,384 | 1,500 | 1,669 | 1,573 | 1,119 |
| 2012 | 1,133 | 993 | 1,066 | 362 | 350 | 218 | 205 | 282 | 237 | 249 | 272 | 251 |
| 2013 | 272 | 209 | 284 | 222 | 358 | 274 | 337 | 284 | 321 | 213 | 251 | 231 |
| 2014 | 190 | 171 | 376 | 191 | 289 | 350 | 284 | 328 | 298 | 351 | 393 | 513 |
| 2015 | 447 | 389 | 439 | 503 | 503 | 369 | 389 | 440 | 431 | 349 | 389 | 435 |
| 2016 | 397 | 385 | 399 | 403 | 433 | 409 | 412 | 403 | 592 | 548 | 611 | 379 |
| 2017 | 309 | 390 | 419 | 427 | 501 | 429 | 498 | 479 | 477 | 450 | 436 | 353 |
| 2018 | 254 | 267 | 337 | 355 | 436 | 310 | 391 | 382 | 287 | 374 | 387 | 406 |
| 2019 | 361 | 504 | 435 | 409 | 530 | 471 | 446 | 468 | 506 | 536 | 547 | 540 |
| 2020 | 565 | 489 | 555 | 366 | 508 | 582 | 566 | 550 | 540 | 591 | 572 | 611 |
| 2021 | 518 | 321 | 414 | 404 | 626 | 458 | 511 | 530 | 600 | 592 | 566 | 535 |
| 2022 | 469 | 458 | 506 | 556 | 577 | 514 | 565 | 487 | 509 | 625 | 495 | 524 |
| 2023 | 521 | 540 | 565 | 441 | 543 | 587 | 557 | 621 | 646 | 739 | 712 | 736 |
| 2024 | 624 | 555 | ||||||||||
| - = No Data Reported; -- = Not Applicable; NA = Not Available; W = Withheld to avoid disclosure of individual company data. |
| Release Date: 4/30/2024 |
| Next Release Date: 5/31/2024 |