|
Download Data (XLS File) |
|
||||||||
|
||||||||
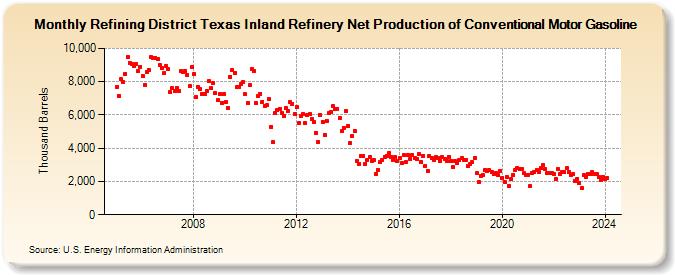
| Refining District Texas Inland Refinery Net Production of Conventional Motor Gasoline (Thousand Barrels) | ||||||||
| Year | Jan | Feb | Mar | Apr | May | Jun | Jul | Aug | Sep | Oct | Nov | Dec |
|---|---|---|---|---|---|---|---|---|---|---|---|---|
| 2005 | 7,696 | 7,154 | 8,134 | 7,989 | 8,485 | 9,495 | 9,146 | 9,085 | 8,953 | 9,053 | 8,617 | 8,911 |
| 2006 | 8,326 | 7,808 | 8,582 | 8,730 | 9,470 | 9,406 | 9,451 | 9,349 | 8,987 | 8,813 | 8,535 | 8,942 |
| 2007 | 8,743 | 7,358 | 7,605 | 7,453 | 7,637 | 7,441 | 8,611 | 8,566 | 8,622 | 8,423 | 7,750 | 8,858 |
| 2008 | 8,465 | 7,075 | 7,684 | 7,565 | 7,254 | 7,228 | 7,454 | 8,015 | 7,589 | 7,925 | 7,288 | 6,873 |
| 2009 | 7,270 | 6,735 | 7,270 | 6,790 | 6,433 | 8,302 | 8,693 | 8,505 | 7,652 | 7,695 | 7,851 | 7,967 |
| 2010 | 7,234 | 6,691 | 7,788 | 8,731 | 8,613 | 6,708 | 7,136 | 7,287 | 6,786 | 6,559 | 6,576 | 6,953 |
| 2011 | 5,296 | 4,352 | 6,100 | 6,308 | 6,368 | 6,134 | 5,946 | 6,398 | 6,257 | 6,757 | 6,685 | 6,052 |
| 2012 | 6,475 | 5,535 | 5,964 | 6,068 | 5,490 | 6,003 | 6,035 | 5,735 | 5,588 | 4,943 | 4,361 | 6,001 |
| 2013 | 5,604 | 4,808 | 5,645 | 6,118 | 6,175 | 6,512 | 6,363 | 6,360 | 5,831 | 5,028 | 5,231 | 6,225 |
| 2014 | 5,354 | 4,302 | 4,716 | 5,050 | 3,211 | 3,050 | 3,516 | 3,532 | 3,072 | 3,318 | 3,462 | 3,247 |
| 2015 | 3,271 | 2,459 | 2,705 | 3,180 | 3,306 | 3,483 | 3,547 | 3,695 | 3,492 | 3,279 | 3,453 | 3,257 |
| 2016 | 3,385 | 3,097 | 3,584 | 3,171 | 3,591 | 3,358 | 3,582 | 3,411 | 3,361 | 3,645 | 3,194 | 3,554 |
| 2017 | 2,936 | 2,644 | 3,524 | 3,424 | 3,305 | 3,455 | 3,414 | 3,248 | 3,461 | 3,327 | 3,213 | 3,492 |
| 2018 | 3,252 | 2,839 | 3,203 | 3,125 | 3,296 | 3,380 | 3,311 | 3,294 | 2,920 | 3,069 | 3,150 | 3,399 |
| 2019 | 2,482 | 1,939 | 2,345 | 2,382 | 2,695 | 2,646 | 2,662 | 2,573 | 2,477 | 2,505 | 2,393 | 2,653 |
| 2020 | 2,236 | 1,991 | 2,269 | 1,724 | 2,134 | 2,412 | 2,686 | 2,827 | 2,730 | 2,754 | 2,478 | 2,408 |
| 2021 | 2,417 | 1,722 | 2,524 | 2,582 | 2,691 | 2,576 | 2,786 | 2,964 | 2,740 | 2,533 | 2,496 | 2,504 |
| 2022 | 2,474 | 2,156 | 2,734 | 2,445 | 2,568 | 2,543 | 2,791 | 2,596 | 2,392 | 2,444 | 2,051 | 2,171 |
| 2023 | 1,891 | 1,603 | 2,358 | 2,243 | 2,461 | 2,432 | 2,587 | 2,462 | 2,431 | 2,262 | 2,097 | 2,286 |
| 2024 | 2,130 | |||||||||||
| - = No Data Reported; -- = Not Applicable; NA = Not Available; W = Withheld to avoid disclosure of individual company data. |
| Release Date: 3/29/2024 |
| Next Release Date: 4/30/2024 |