|
Download Data (XLS File) |
|
||||||||
|
||||||||
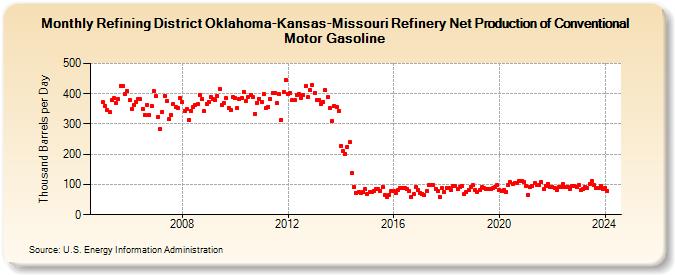
| Refining District Oklahoma-Kansas-Missouri Refinery Net Production of Conventional Motor Gasoline (Thousand Barrels per Day) | ||||||||
| Year | Jan | Feb | Mar | Apr | May | Jun | Jul | Aug | Sep | Oct | Nov | Dec |
|---|---|---|---|---|---|---|---|---|---|---|---|---|
| 2005 | 371 | 360 | 347 | 341 | 378 | 385 | 369 | 382 | 426 | 426 | 399 | 409 |
| 2006 | 380 | 351 | 363 | 374 | 382 | 382 | 351 | 329 | 364 | 331 | 360 | 408 |
| 2007 | 392 | 323 | 284 | 341 | 393 | 376 | 315 | 331 | 365 | 356 | 354 | 385 |
| 2008 | 372 | 343 | 348 | 314 | 344 | 355 | 363 | 365 | 396 | 381 | 342 | 367 |
| 2009 | 374 | 388 | 382 | 380 | 391 | 416 | 363 | 370 | 385 | 352 | 347 | 388 |
| 2010 | 386 | 353 | 382 | 385 | 407 | 376 | 390 | 396 | 390 | 334 | 370 | 383 |
| 2011 | 373 | 400 | 353 | 357 | 384 | 404 | 403 | 368 | 398 | 314 | 405 | 447 |
| 2012 | 400 | 403 | 379 | 379 | 397 | 399 | 387 | 397 | 425 | 388 | 412 | 430 |
| 2013 | 404 | 379 | 379 | 367 | 373 | 412 | 389 | 353 | 310 | 360 | 357 | 343 |
| 2014 | 228 | 209 | 202 | 224 | 239 | 139 | 91 | 73 | 75 | 72 | 74 | 85 |
| 2015 | 69 | 74 | 75 | 80 | 84 | 85 | 80 | 90 | 65 | 60 | 66 | 79 |
| 2016 | 77 | 72 | 83 | 89 | 89 | 89 | 86 | 78 | 60 | 67 | 91 | 82 |
| 2017 | 72 | 69 | 64 | 77 | 99 | 98 | 99 | 86 | 78 | 60 | 87 | 74 |
| 2018 | 89 | 87 | 81 | 94 | 94 | 85 | 92 | 96 | 67 | 74 | 83 | 91 |
| 2019 | 97 | 82 | 76 | 82 | 91 | 88 | 86 | 86 | 85 | 87 | 91 | 97 |
| 2020 | 82 | 79 | 82 | 76 | 99 | 107 | 102 | 105 | 104 | 113 | 111 | 107 |
| 2021 | 96 | 65 | 92 | 95 | 105 | 99 | 98 | 108 | 84 | 96 | 103 | 90 |
| 2022 | 93 | 87 | 82 | 91 | 91 | 100 | 91 | 92 | 86 | 95 | 96 | 90 |
| 2023 | 97 | 82 | 85 | 92 | 88 | 101 | 110 | 97 | 88 | 89 | 96 | 86 |
| 2024 | 89 | 79 | ||||||||||
| - = No Data Reported; -- = Not Applicable; NA = Not Available; W = Withheld to avoid disclosure of individual company data. |
| Release Date: 4/30/2024 |
| Next Release Date: 5/31/2024 |