|
Download Data (XLS File) |
|
||||||||
|
||||||||
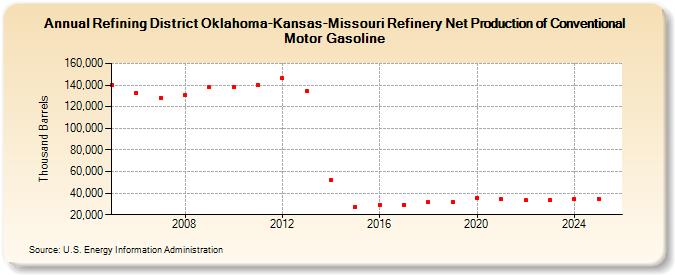
| Refining District Oklahoma-Kansas-Missouri Refinery Net Production of Conventional Motor Gasoline (Thousand Barrels) | ||||||||
| Decade | Year-0 | Year-1 | Year-2 | Year-3 | Year-4 | Year-5 | Year-6 | Year-7 | Year-8 | Year-9 |
|---|---|---|---|---|---|---|---|---|---|---|
| 2000's | 139,692 | 133,048 | 128,275 | 130,838 | 137,885 | |||||
| 2010's | 138,562 | 139,976 | 146,213 | 134,601 | 51,910 | 27,541 | 29,335 | 29,308 | 31,426 | 31,869 |
| 2020's | 35,617 | 34,506 | 33,291 | 33,834 |
| - = No Data Reported; -- = Not Applicable; NA = Not Available; W = Withheld to avoid disclosure of individual company data. |
| Release Date: 3/29/2024 |
| Next Release Date: 8/30/2024 |