|
Download Data (XLS File) |
|
||||||||
|
||||||||
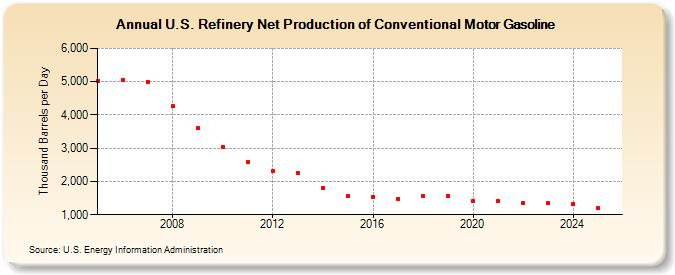
| U.S. Refinery Net Production of Conventional Motor Gasoline (Thousand Barrels per Day) | ||||||||
| Decade | Year-0 | Year-1 | Year-2 | Year-3 | Year-4 | Year-5 | Year-6 | Year-7 | Year-8 | Year-9 |
|---|---|---|---|---|---|---|---|---|---|---|
| 2000's | 5,033 | 5,040 | 4,992 | 4,268 | 3,607 | |||||
| 2010's | 3,024 | 2,587 | 2,302 | 2,252 | 1,814 | 1,559 | 1,540 | 1,486 | 1,562 | 1,573 |
| 2020's | 1,406 | 1,403 | 1,352 | 1,344 |
| - = No Data Reported; -- = Not Applicable; NA = Not Available; W = Withheld to avoid disclosure of individual company data. |
| Release Date: 8/30/2024 |
| Next Release Date: 8/29/2025 |