|
Download Data (XLS File) |
|
||||||||
|
||||||||
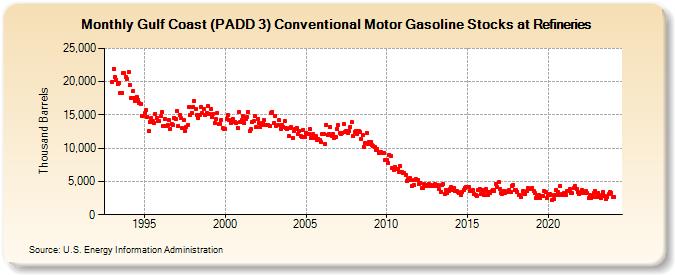
| Gulf Coast (PADD 3) Conventional Motor Gasoline Stocks at Refineries (Thousand Barrels) | ||||||||
| Year | Jan | Feb | Mar | Apr | May | Jun | Jul | Aug | Sep | Oct | Nov | Dec |
|---|---|---|---|---|---|---|---|---|---|---|---|---|
| 1993 | 20,014 | 21,943 | 20,626 | 20,300 | 19,685 | 19,817 | 18,326 | 18,358 | 21,303 | 21,240 | 20,710 | 20,445 |
| 1994 | 21,520 | 19,538 | 17,480 | 18,523 | 17,558 | 17,050 | 17,761 | 17,295 | 16,783 | 16,578 | 14,864 | 14,807 |
| 1995 | 15,214 | 15,717 | 14,736 | 12,575 | 13,971 | 14,539 | 14,058 | 13,733 | 15,145 | 14,542 | 14,158 | 14,140 |
| 1996 | 14,769 | 15,432 | 13,400 | 14,406 | 13,354 | 13,458 | 14,173 | 12,863 | 13,605 | 13,433 | 14,509 | 14,447 |
| 1997 | 15,637 | 13,326 | 14,972 | 14,470 | 13,005 | 14,167 | 12,618 | 13,171 | 13,451 | 16,232 | 15,058 | 15,344 |
| 1998 | 16,236 | 17,110 | 15,941 | 14,943 | 14,524 | 14,991 | 16,165 | 15,280 | 15,882 | 15,021 | 15,342 | 16,269 |
| 1999 | 15,167 | 15,946 | 14,700 | 15,207 | 13,760 | 14,435 | 15,300 | 13,564 | 13,638 | 14,296 | 12,979 | 12,884 |
| 2000 | 12,945 | 14,442 | 14,957 | 14,275 | 13,781 | 13,939 | 14,338 | 13,940 | 13,841 | 13,054 | 15,406 | 13,896 |
| 2001 | 14,213 | 14,887 | 13,716 | 14,361 | 14,615 | 15,403 | 12,568 | 12,810 | 13,889 | 14,037 | 14,782 | 13,172 |
| 2002 | 14,325 | 13,831 | 13,160 | 13,525 | 13,824 | 14,230 | 13,507 | 13,513 | 13,462 | 13,332 | 15,279 | 15,503 |
| 2003 | 13,725 | 14,830 | 13,383 | 13,415 | 14,195 | 12,942 | 13,500 | 13,241 | 14,118 | 12,968 | 12,882 | 11,818 |
| 2004 | 12,982 | 13,123 | 11,588 | 12,544 | 12,850 | 13,059 | 12,109 | 12,572 | 11,849 | 11,678 | 12,735 | 11,697 |
| 2005 | 12,324 | 12,099 | 12,078 | 12,819 | 11,545 | 12,161 | 11,483 | 11,891 | 11,210 | 11,351 | 11,227 | 10,950 |
| 2006 | 12,100 | 12,113 | 10,703 | 13,513 | 12,021 | 12,161 | 13,205 | 11,886 | 12,143 | 11,479 | 11,669 | 12,932 |
| 2007 | 13,414 | 12,239 | 12,108 | 12,253 | 13,576 | 12,498 | 12,599 | 12,212 | 12,602 | 13,238 | 13,903 | 11,763 |
| 2008 | 12,402 | 12,655 | 12,206 | 12,518 | 12,419 | 11,430 | 11,944 | 10,188 | 10,788 | 12,332 | 10,554 | 10,967 |
| 2009 | 11,004 | 10,497 | 10,295 | 10,231 | 9,730 | 9,842 | 9,289 | 9,456 | 9,371 | 9,246 | 9,310 | 8,245 |
| 2010 | 8,278 | 7,809 | 9,014 | 8,874 | 7,094 | 6,765 | 7,225 | 6,919 | 6,857 | 6,467 | 7,250 | 6,375 |
| 2011 | 6,207 | 6,224 | 5,965 | 5,095 | 5,337 | 5,501 | 5,201 | 4,347 | 4,497 | 5,219 | 5,326 | 5,278 |
| 2012 | 4,667 | 4,833 | 4,005 | 4,034 | 4,567 | 4,372 | 4,515 | 4,552 | 4,251 | 4,481 | 4,352 | 4,261 |
| 2013 | 4,545 | 4,270 | 4,427 | 3,814 | 3,433 | 4,496 | 4,630 | 3,098 | 3,787 | 3,196 | 3,539 | 3,804 |
| 2014 | 4,132 | 3,666 | 4,039 | 3,571 | 3,561 | 3,340 | 3,216 | 2,995 | 3,398 | 3,697 | 4,031 | 4,126 |
| 2015 | 4,198 | 4,112 | 3,628 | 3,494 | 3,703 | 3,093 | 3,004 | 2,873 | 3,746 | 3,890 | 3,177 | 3,734 |
| 2016 | 2,940 | 3,627 | 3,830 | 3,031 | 3,394 | 3,199 | 3,500 | 3,754 | 3,614 | 4,678 | 4,176 | 4,844 |
| 2017 | 3,834 | 3,306 | 3,101 | 3,555 | 3,259 | 3,387 | 3,540 | 3,729 | 3,371 | 4,339 | 4,478 | 3,729 |
| 2018 | 3,709 | 3,470 | 3,000 | 2,901 | 2,669 | 3,522 | 3,305 | 3,165 | 3,500 | 3,965 | 3,818 | 3,878 |
| 2019 | 4,065 | 3,531 | 3,242 | 2,520 | 2,768 | 2,912 | 2,554 | 2,770 | 2,812 | 3,530 | 3,342 | 2,504 |
| 2020 | 2,965 | 3,171 | 2,992 | 2,207 | 2,317 | 2,900 | 3,720 | 3,418 | 2,995 | 4,361 | 3,059 | 2,994 |
| 2021 | 3,328 | 3,028 | 3,587 | 3,622 | 3,829 | 3,322 | 3,224 | 4,004 | 4,298 | 3,917 | 3,473 | 3,058 |
| 2022 | 3,201 | 3,687 | 3,318 | 3,320 | 3,520 | 3,228 | 2,537 | 2,905 | 2,490 | 2,731 | 3,255 | 3,558 |
| 2023 | 2,705 | 3,303 | 2,830 | 2,527 | 2,892 | 3,393 | 2,816 | 2,304 | 2,693 | 3,073 | 3,489 | 3,325 |
| 2024 | 2,726 | |||||||||||
| - = No Data Reported; -- = Not Applicable; NA = Not Available; W = Withheld to avoid disclosure of individual company data. |
| Release Date: 3/29/2024 |
| Next Release Date: 4/30/2024 |