|
Download Data (XLS File) |
|
||||||||
|
||||||||
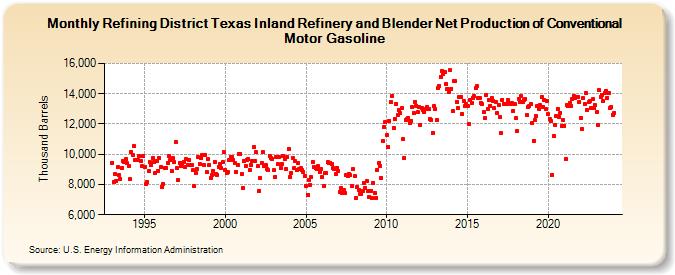
| Refining District Texas Inland Refinery and Blender Net Production of Conventional Motor Gasoline (Thousand Barrels) | ||||||||
| Year | Jan | Feb | Mar | Apr | May | Jun | Jul | Aug | Sep | Oct | Nov | Dec |
|---|---|---|---|---|---|---|---|---|---|---|---|---|
| 1993 | 9,443 | 8,149 | 8,682 | 8,233 | 9,124 | 8,619 | 8,379 | 9,102 | 9,551 | 9,501 | 9,677 | 9,400 |
| 1994 | 9,207 | 8,340 | 10,171 | 9,977 | 10,554 | 9,646 | 9,636 | 9,613 | 9,869 | 9,523 | 9,191 | 9,878 |
| 1995 | 9,133 | 8,004 | 8,155 | 8,900 | 9,481 | 9,258 | 9,729 | 9,474 | 8,787 | 9,582 | 8,915 | 9,734 |
| 1996 | 9,131 | 7,836 | 8,031 | 9,120 | 9,105 | 9,414 | 9,896 | 9,617 | 8,894 | 9,732 | 9,481 | 10,808 |
| 1997 | 9,114 | 8,286 | 9,432 | 9,232 | 9,408 | 9,472 | 9,175 | 9,666 | 9,299 | 9,622 | 9,268 | 9,303 |
| 1998 | 8,931 | 7,866 | 8,745 | 9,047 | 9,795 | 9,348 | 9,744 | 9,917 | 9,298 | 9,951 | 8,809 | 9,654 |
| 1999 | 9,278 | 8,439 | 8,636 | 8,920 | 9,503 | 8,709 | 8,649 | 9,141 | 9,354 | 9,058 | 9,462 | 10,127 |
| 2000 | 8,968 | 8,748 | 8,830 | 9,624 | 9,839 | 9,785 | 9,620 | 9,443 | 8,841 | 9,290 | 10,022 | 10,029 |
| 2001 | 8,699 | 7,799 | 9,541 | 9,236 | 9,637 | 9,678 | 8,970 | 9,268 | 9,524 | 10,501 | 9,580 | 10,114 |
| 2002 | 9,197 | 7,573 | 8,432 | 9,422 | 10,140 | 9,216 | 9,293 | 9,003 | 8,931 | 9,892 | 9,773 | 9,675 |
| 2003 | 8,931 | 8,511 | 9,795 | 9,325 | 9,793 | 9,080 | 9,357 | 9,865 | 9,665 | 9,027 | 9,840 | 10,348 |
| 2004 | 8,510 | 8,767 | 9,754 | 9,062 | 9,519 | 8,947 | 9,432 | 9,043 | 9,066 | 8,928 | 8,844 | 8,545 |
| 2005 | 7,889 | 7,329 | 8,315 | 7,989 | 8,485 | 9,495 | 9,146 | 9,085 | 9,035 | 9,203 | 8,808 | 9,019 |
| 2006 | 8,474 | 7,908 | 8,736 | 8,730 | 9,470 | 9,406 | 9,451 | 9,349 | 9,063 | 8,991 | 8,709 | 9,113 |
| 2007 | 8,910 | 7,523 | 7,777 | 7,454 | 7,637 | 7,441 | 8,611 | 8,566 | 8,696 | 8,597 | 7,913 | 8,995 |
| 2008 | 8,542 | 7,119 | 7,840 | 7,667 | 7,376 | 7,375 | 7,576 | 8,103 | 7,770 | 8,217 | 7,563 | 7,178 |
| 2009 | 7,595 | 7,116 | 8,094 | 7,468 | 7,131 | 8,986 | 9,395 | 9,233 | 8,436 | 10,857 | 11,829 | 12,109 |
| 2010 | 11,293 | 10,467 | 12,214 | 13,426 | 13,869 | 11,756 | 12,350 | 13,342 | 12,590 | 12,896 | 12,722 | 13,042 |
| 2011 | 10,992 | 9,758 | 12,267 | 12,306 | 12,399 | 12,090 | 12,205 | 13,105 | 12,731 | 13,486 | 13,220 | 12,763 |
| 2012 | 13,107 | 11,942 | 13,061 | 12,957 | 12,765 | 13,011 | 13,105 | 12,991 | 12,322 | 12,248 | 11,432 | 13,167 |
| 2013 | 12,976 | 12,257 | 14,350 | 14,520 | 15,124 | 15,487 | 15,310 | 15,407 | 14,669 | 14,343 | 14,143 | 15,538 |
| 2014 | 14,332 | 12,826 | 14,812 | 14,832 | 13,482 | 13,069 | 13,803 | 13,808 | 12,689 | 13,508 | 13,157 | 13,343 |
| 2015 | 13,199 | 12,024 | 13,571 | 13,408 | 13,746 | 13,838 | 14,375 | 14,501 | 13,706 | 13,749 | 13,371 | 13,295 |
| 2016 | 12,791 | 12,379 | 13,935 | 12,983 | 13,609 | 13,204 | 13,743 | 13,502 | 13,038 | 13,439 | 12,715 | 13,278 |
| 2017 | 12,445 | 11,375 | 13,616 | 13,335 | 13,353 | 13,301 | 13,601 | 13,402 | 13,351 | 13,361 | 12,859 | 13,338 |
| 2018 | 12,412 | 11,547 | 13,663 | 13,448 | 13,831 | 13,474 | 13,564 | 13,653 | 12,607 | 13,145 | 13,201 | 13,321 |
| 2019 | 12,059 | 10,899 | 12,269 | 12,499 | 13,200 | 12,996 | 13,227 | 13,792 | 13,150 | 13,602 | 13,012 | 13,487 |
| 2020 | 12,629 | 12,323 | 12,211 | 8,647 | 11,215 | 11,961 | 12,535 | 13,000 | 12,479 | 12,710 | 11,892 | 12,234 |
| 2021 | 11,889 | 9,693 | 13,278 | 13,166 | 13,395 | 13,211 | 13,668 | 13,869 | 13,744 | 13,753 | 13,795 | 13,463 |
| 2022 | 12,394 | 11,694 | 13,700 | 13,330 | 14,036 | 12,925 | 13,464 | 13,497 | 13,042 | 13,624 | 13,029 | 13,222 |
| 2023 | 12,762 | 11,964 | 14,218 | 13,802 | 13,947 | 13,501 | 14,081 | 14,197 | 13,741 | 14,018 | 13,044 | 13,110 |
| 2024 | 12,612 | |||||||||||
| - = No Data Reported; -- = Not Applicable; NA = Not Available; W = Withheld to avoid disclosure of individual company data. |
| Release Date: 3/29/2024 |
| Next Release Date: 4/30/2024 |