|
Download Data (XLS File) |
|
||||||||
|
||||||||
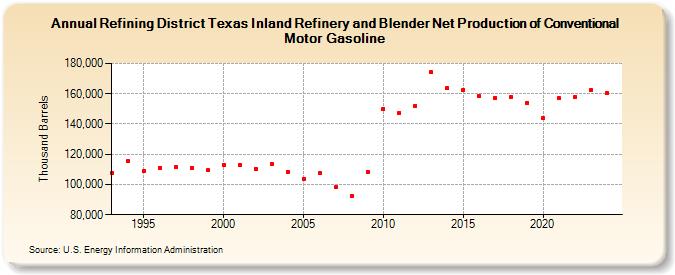
| Refining District Texas Inland Refinery and Blender Net Production of Conventional Motor Gasoline (Thousand Barrels) | ||||||||
| Decade | Year-0 | Year-1 | Year-2 | Year-3 | Year-4 | Year-5 | Year-6 | Year-7 | Year-8 | Year-9 |
|---|---|---|---|---|---|---|---|---|---|---|
| 1990's | 107,860 | 115,605 | 109,152 | 111,065 | 111,277 | 111,105 | 109,276 | |||
| 2000's | 113,039 | 112,547 | 110,547 | 113,537 | 108,417 | 103,798 | 107,400 | 98,120 | 92,326 | 108,249 |
| 2010's | 149,967 | 147,322 | 152,108 | 174,124 | 163,661 | 162,783 | 158,616 | 157,337 | 157,866 | 154,192 |
| 2020's | 143,836 | 156,924 | 157,957 | 162,385 |
| - = No Data Reported; -- = Not Applicable; NA = Not Available; W = Withheld to avoid disclosure of individual company data. |
| Release Date: 3/29/2024 |
| Next Release Date: 8/30/2024 |