|
Download Data (XLS File) |
|
||||||||
|
||||||||
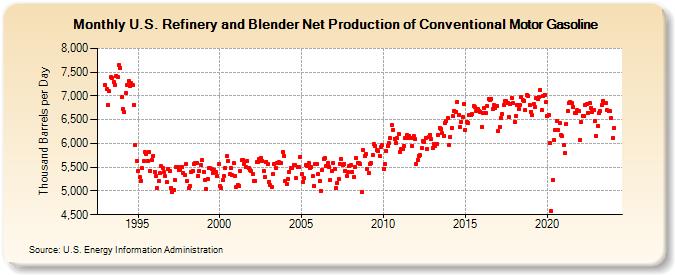
| U.S. Refinery and Blender Net Production of Conventional Motor Gasoline (Thousand Barrels per Day) | ||||||||
| Year | Jan | Feb | Mar | Apr | May | Jun | Jul | Aug | Sep | Oct | Nov | Dec |
|---|---|---|---|---|---|---|---|---|---|---|---|---|
| 1993 | 7,226 | 7,138 | 6,819 | 7,097 | 7,392 | 7,384 | 7,294 | 7,233 | 7,427 | 7,397 | 7,640 | 7,597 |
| 1994 | 6,978 | 6,724 | 6,656 | 7,065 | 7,227 | 7,309 | 7,217 | 7,262 | 7,224 | 6,815 | 5,970 | 5,637 |
| 1995 | 5,430 | 5,285 | 5,212 | 5,475 | 5,623 | 5,811 | 5,784 | 5,636 | 5,823 | 5,430 | 5,642 | 5,736 |
| 1996 | 5,408 | 5,318 | 5,052 | 5,206 | 5,368 | 5,518 | 5,482 | 5,392 | 5,307 | 5,193 | 5,464 | 5,420 |
| 1997 | 5,072 | 4,976 | 5,027 | 5,231 | 5,511 | 5,509 | 5,431 | 5,459 | 5,512 | 5,379 | 5,343 | 5,561 |
| 1998 | 5,212 | 5,053 | 5,108 | 5,392 | 5,422 | 5,573 | 5,581 | 5,598 | 5,316 | 5,421 | 5,548 | 5,650 |
| 1999 | 5,407 | 5,221 | 5,040 | 5,254 | 5,481 | 5,473 | 5,452 | 5,369 | 5,448 | 5,407 | 5,310 | 5,562 |
| 2000 | 5,097 | 5,061 | 5,220 | 5,315 | 5,488 | 5,727 | 5,639 | 5,348 | 5,486 | 5,327 | 5,587 | 5,310 |
| 2001 | 5,085 | 5,132 | 5,113 | 5,422 | 5,643 | 5,653 | 5,561 | 5,505 | 5,637 | 5,488 | 5,440 | 5,413 |
| 2002 | 5,357 | 5,199 | 5,217 | 5,612 | 5,605 | 5,663 | 5,690 | 5,640 | 5,430 | 5,302 | 5,618 | 5,560 |
| 2003 | 5,198 | 5,115 | 5,084 | 5,354 | 5,559 | 5,485 | 5,594 | 5,602 | 5,585 | 5,589 | 5,826 | 5,740 |
| 2004 | 5,207 | 5,149 | 5,254 | 5,406 | 5,487 | 5,475 | 5,542 | 5,546 | 5,267 | 5,496 | 5,496 | 5,715 |
| 2005 | 5,353 | 5,197 | 5,269 | 5,546 | 5,528 | 5,588 | 5,484 | 5,499 | 5,307 | 5,113 | 5,568 | 5,567 |
| 2006 | 5,351 | 5,202 | 4,998 | 5,442 | 5,676 | 5,686 | 5,515 | 5,583 | 5,509 | 5,227 | 5,429 | 5,591 |
| 2007 | 5,472 | 5,066 | 5,171 | 5,250 | 5,568 | 5,670 | 5,538 | 5,573 | 5,420 | 5,305 | 5,399 | 5,531 |
| 2008 | 5,536 | 5,406 | 5,286 | 5,499 | 5,695 | 5,583 | 5,590 | 5,560 | 4,976 | 5,853 | 5,727 | 5,784 |
| 2009 | 5,471 | 5,370 | 5,571 | 5,583 | 5,758 | 5,988 | 5,944 | 5,856 | 5,840 | 5,746 | 5,933 | 5,961 |
| 2010 | 5,460 | 5,559 | 5,849 | 5,949 | 6,003 | 6,110 | 6,381 | 6,292 | 6,094 | 6,010 | 6,107 | 6,206 |
| 2011 | 5,819 | 5,879 | 5,887 | 5,953 | 6,106 | 6,182 | 6,105 | 6,160 | 6,106 | 5,952 | 6,153 | 6,095 |
| 2012 | 5,569 | 5,652 | 5,744 | 5,748 | 5,908 | 6,054 | 6,039 | 6,124 | 5,884 | 6,144 | 6,184 | 6,096 |
| 2013 | 5,900 | 5,998 | 5,952 | 5,994 | 6,182 | 6,329 | 6,300 | 6,210 | 6,159 | 6,430 | 6,465 | 6,532 |
| 2014 | 5,969 | 6,137 | 6,335 | 6,568 | 6,684 | 6,666 | 6,881 | 6,605 | 6,349 | 6,458 | 6,548 | 6,820 |
| 2015 | 6,291 | 6,454 | 6,436 | 6,604 | 6,597 | 6,609 | 6,789 | 6,758 | 6,685 | 6,721 | 6,677 | 6,663 |
| 2016 | 6,354 | 6,642 | 6,738 | 6,638 | 6,783 | 6,934 | 6,918 | 6,945 | 6,728 | 6,802 | 6,755 | 6,791 |
| 2017 | 6,254 | 6,355 | 6,538 | 6,622 | 6,804 | 6,896 | 6,889 | 6,858 | 6,548 | 6,820 | 6,963 | 6,844 |
| 2018 | 6,452 | 6,578 | 6,808 | 6,727 | 6,814 | 6,975 | 6,916 | 6,893 | 6,699 | 7,021 | 7,003 | 6,810 |
| 2019 | 6,671 | 6,588 | 6,836 | 6,761 | 6,951 | 6,930 | 6,976 | 7,132 | 6,698 | 7,003 | 7,025 | 6,866 |
| 2020 | 6,585 | 6,607 | 6,000 | 4,568 | 5,228 | 6,067 | 6,275 | 6,467 | 6,292 | 6,423 | 6,183 | 6,147 |
| 2021 | 5,959 | 5,793 | 6,417 | 6,678 | 6,850 | 6,869 | 6,843 | 6,774 | 6,637 | 6,649 | 6,697 | 6,690 |
| 2022 | 6,073 | 6,448 | 6,574 | 6,574 | 6,813 | 6,824 | 6,650 | 6,855 | 6,751 | 6,658 | 6,711 | 6,479 |
| 2023 | 6,164 | 6,373 | 6,631 | 6,674 | 6,810 | 6,894 | 6,847 | 6,848 | 6,694 | 6,682 | 6,672 | 6,545 |
| 2024 | 6,124 | |||||||||||
| - = No Data Reported; -- = Not Applicable; NA = Not Available; W = Withheld to avoid disclosure of individual company data. |
| Release Date: 3/29/2024 |
| Next Release Date: 4/30/2024 |