|
Download Data (XLS File) |
|
||||||||
|
||||||||
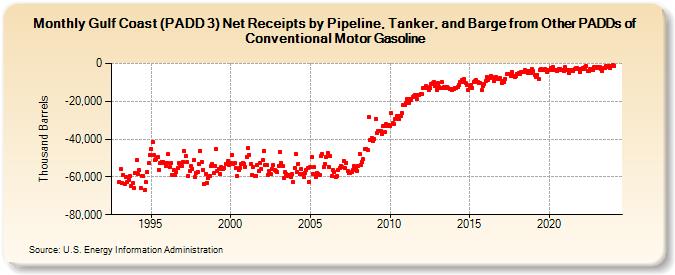
| Gulf Coast (PADD 3) Net Receipts by Pipeline, Tanker, and Barge from Other PADDs of Conventional Motor Gasoline (Thousand Barrels) | ||||||||
| Year | Jan | Feb | Mar | Apr | May | Jun | Jul | Aug | Sep | Oct | Nov | Dec |
|---|---|---|---|---|---|---|---|---|---|---|---|---|
| 1993 | -62,475 | -55,802 | -63,234 | -59,107 | -63,620 | -59,842 | -62,742 | -61,603 | -59,375 | -64,981 | -63,318 | -65,819 |
| 1994 | -57,949 | -51,008 | -58,482 | -56,409 | -65,734 | -59,737 | -59,534 | -67,003 | -62,785 | -57,339 | -52,892 | -48,378 |
| 1995 | -45,118 | -41,512 | -48,646 | -50,912 | -50,400 | -49,610 | -56,158 | -52,498 | -51,973 | -52,011 | -52,386 | -54,187 |
| 1996 | -52,499 | -48,003 | -54,993 | -52,864 | -58,728 | -56,252 | -58,759 | -57,517 | -55,188 | -52,850 | -53,947 | -54,320 |
| 1997 | -51,977 | -46,521 | -48,737 | -52,321 | -59,728 | -56,796 | -54,445 | -55,669 | -51,128 | -60,137 | -58,108 | -57,149 |
| 1998 | -53,312 | -46,247 | -52,010 | -56,144 | -63,720 | -58,298 | -63,055 | -60,677 | -59,297 | -54,451 | -53,174 | -58,144 |
| 1999 | -54,130 | -45,382 | -56,894 | -55,682 | -58,559 | -54,959 | -55,879 | -55,517 | -53,142 | -53,277 | -51,406 | -53,721 |
| 2000 | -52,437 | -48,539 | -52,934 | -52,724 | -55,309 | -59,650 | -56,572 | -55,252 | -53,103 | -52,692 | -53,388 | -54,630 |
| 2001 | -49,364 | -44,733 | -48,172 | -52,991 | -58,764 | -54,996 | -59,290 | -59,359 | -53,704 | -57,090 | -52,455 | -55,791 |
| 2002 | -51,287 | -46,178 | -53,475 | -53,929 | -58,882 | -56,802 | -58,605 | -55,659 | -53,472 | -56,417 | -56,802 | -57,623 |
| 2003 | -54,042 | -46,742 | -52,436 | -54,216 | -60,662 | -57,373 | -58,318 | -59,499 | -59,163 | -59,961 | -58,723 | -62,598 |
| 2004 | -55,120 | -47,790 | -57,398 | -52,944 | -58,201 | -55,709 | -58,689 | -60,053 | -57,816 | -56,399 | -55,165 | -62,663 |
| 2005 | -54,693 | -49,560 | -58,282 | -54,932 | -60,121 | -58,053 | -58,254 | -59,206 | -49,105 | -47,797 | -54,962 | -53,126 |
| 2006 | -49,521 | -47,095 | -54,823 | -49,123 | -59,646 | -56,476 | -57,310 | -60,100 | -59,750 | -56,404 | -55,378 | -54,029 |
| 2007 | -55,003 | -51,446 | -55,422 | -52,434 | -56,729 | -57,931 | -57,833 | -57,456 | -56,117 | -54,200 | -55,972 | -56,885 |
| 2008 | -54,122 | -47,680 | -53,505 | -52,066 | -50,675 | -45,279 | -44,991 | -45,601 | -28,560 | -40,458 | -39,207 | -40,765 |
| 2009 | -39,974 | -29,361 | -36,925 | -35,504 | -35,648 | -35,626 | -37,182 | -33,334 | -36,101 | -32,152 | -33,193 | -32,632 |
| 2010 | -32,894 | -26,209 | -31,567 | -32,069 | -29,242 | -27,879 | -27,628 | -29,155 | -27,751 | -26,080 | -22,128 | -21,751 |
| 2011 | -20,722 | -18,923 | -21,034 | -18,621 | -19,135 | -17,857 | -17,447 | -16,433 | -18,860 | -16,569 | -16,678 | -15,992 |
| 2012 | -15,958 | -13,038 | -13,075 | -12,117 | -12,502 | -13,879 | -13,189 | -10,646 | -10,212 | -9,803 | -11,663 | -13,904 |
| 2013 | -10,457 | -12,536 | -13,058 | -9,865 | -12,929 | -12,231 | -12,804 | -12,265 | -13,090 | -13,664 | -13,427 | -14,170 |
| 2014 | -13,561 | -12,739 | -13,139 | -12,391 | -11,382 | -10,051 | -8,885 | -9,730 | -8,358 | -10,416 | -11,560 | -13,965 |
| 2015 | -11,814 | -11,573 | -13,095 | -9,718 | -9,507 | -8,770 | -9,620 | -10,356 | -10,124 | -14,175 | -11,681 | -10,672 |
| 2016 | -9,226 | -7,127 | -8,494 | -7,567 | -6,526 | -7,343 | -9,188 | -7,615 | -7,200 | -8,183 | -7,974 | -7,822 |
| 2017 | -10,118 | -9,417 | -9,611 | -8,009 | -5,720 | -5,764 | -5,775 | -6,840 | -4,465 | -6,623 | -7,057 | -6,549 |
| 2018 | -5,522 | -5,122 | -5,657 | -4,642 | -4,544 | -4,360 | -3,623 | -4,056 | -5,288 | -4,050 | -4,795 | -3,116 |
| 2019 | -3,981 | -6,062 | -7,018 | -6,054 | -8,080 | -3,448 | -3,053 | -3,614 | -3,451 | -3,017 | -4,296 | -3,337 |
| 2020 | -3,693 | -2,191 | -3,387 | -2,103 | -3,279 | -3,360 | -3,786 | -2,886 | -2,708 | -3,311 | -3,702 | -4,165 |
| 2021 | -2,058 | -3,624 | -3,437 | -5,056 | -3,409 | -3,455 | -3,818 | -2,998 | -2,470 | -2,504 | -3,014 | -4,719 |
| 2022 | -3,050 | -2,512 | -2,810 | -2,030 | -1,359 | -3,931 | -4,080 | -2,725 | -2,809 | -3,643 | -1,672 | -2,032 |
| 2023 | -2,246 | -1,781 | -1,838 | -2,750 | -4,035 | -2,571 | -2,486 | -1,362 | -1,659 | -1,387 | -2,235 | -1,235 |
| 2024 | -1,028 | |||||||||||
| - = No Data Reported; -- = Not Applicable; NA = Not Available; W = Withheld to avoid disclosure of individual company data. |
| Release Date: 3/29/2024 |
| Next Release Date: 4/30/2024 |