|
Download Data (XLS File) |
|
||||||||
|
||||||||
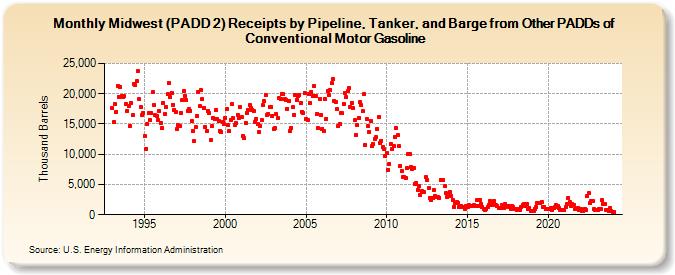
| Midwest (PADD 2) Receipts by Pipeline, Tanker, and Barge from Other PADDs of Conventional Motor Gasoline (Thousand Barrels) | ||||||||
| Year | Jan | Feb | Mar | Apr | May | Jun | Jul | Aug | Sep | Oct | Nov | Dec |
|---|---|---|---|---|---|---|---|---|---|---|---|---|
| 1993 | 17,562 | 15,293 | 18,247 | 17,045 | 21,354 | 19,509 | 21,106 | 19,621 | 19,431 | 19,545 | 18,348 | 17,219 |
| 1994 | 17,940 | 14,664 | 18,508 | 16,403 | 21,627 | 21,480 | 22,039 | 23,715 | 19,075 | 17,804 | 16,468 | 16,869 |
| 1995 | 13,049 | 10,870 | 14,972 | 16,782 | 15,738 | 16,788 | 20,248 | 18,138 | 16,507 | 16,352 | 15,579 | 17,142 |
| 1996 | 15,134 | 14,384 | 18,496 | 16,683 | 17,810 | 19,910 | 21,780 | 19,400 | 20,123 | 18,210 | 17,379 | 16,915 |
| 1997 | 14,105 | 14,761 | 14,646 | 16,824 | 18,959 | 20,381 | 19,694 | 18,936 | 17,220 | 17,427 | 17,207 | 15,417 |
| 1998 | 13,823 | 12,138 | 14,493 | 16,333 | 20,317 | 17,911 | 20,562 | 19,088 | 17,687 | 14,466 | 13,761 | 17,198 |
| 1999 | 16,805 | 12,297 | 14,660 | 15,959 | 15,858 | 17,342 | 15,777 | 15,428 | 13,915 | 13,645 | 15,379 | 14,948 |
| 2000 | 16,033 | 17,494 | 14,773 | 13,842 | 15,621 | 18,237 | 16,001 | 14,838 | 15,187 | 16,459 | 15,974 | 17,829 |
| 2001 | 16,084 | 13,026 | 12,648 | 15,136 | 16,860 | 17,378 | 18,078 | 17,626 | 17,373 | 17,178 | 15,308 | 15,853 |
| 2002 | 14,987 | 13,679 | 14,616 | 15,608 | 18,070 | 18,733 | 19,712 | 16,485 | 16,655 | 17,828 | 17,750 | 16,340 |
| 2003 | 14,169 | 14,406 | 16,574 | 15,953 | 19,222 | 19,198 | 19,957 | 19,890 | 19,124 | 19,041 | 17,552 | 18,767 |
| 2004 | 13,846 | 14,352 | 17,749 | 16,555 | 19,722 | 18,981 | 19,549 | 19,750 | 18,456 | 17,027 | 16,791 | 20,090 |
| 2005 | 15,898 | 15,707 | 19,873 | 18,547 | 20,301 | 19,584 | 21,237 | 19,576 | 16,686 | 14,274 | 19,101 | 16,515 |
| 2006 | 14,224 | 13,772 | 19,184 | 15,854 | 20,432 | 19,785 | 20,554 | 21,706 | 22,382 | 18,785 | 18,635 | 17,474 |
| 2007 | 14,630 | 14,922 | 16,873 | 16,767 | 18,372 | 20,136 | 19,458 | 20,418 | 20,913 | 17,866 | 18,513 | 17,567 |
| 2008 | 15,588 | 13,171 | 14,796 | 16,053 | 18,566 | 18,063 | 17,085 | 19,875 | 11,533 | 15,745 | 14,613 | 13,710 |
| 2009 | 15,546 | 11,342 | 11,703 | 12,571 | 12,788 | 14,212 | 16,176 | 11,928 | 12,227 | 11,180 | 10,809 | 9,632 |
| 2010 | 10,208 | 7,412 | 8,462 | 11,613 | 10,849 | 11,380 | 12,915 | 14,302 | 13,120 | 11,287 | 8,098 | 7,196 |
| 2011 | 6,204 | 6,291 | 5,995 | 7,718 | 10,047 | 10,031 | 7,955 | 7,622 | 7,671 | 5,094 | 5,211 | 4,155 |
| 2012 | 4,667 | 3,279 | 3,890 | 3,784 | 3,686 | 6,157 | 5,730 | 4,347 | 2,752 | 2,463 | 2,763 | 4,121 |
| 2013 | 3,173 | 2,859 | 2,931 | 2,844 | 5,710 | 5,753 | 5,682 | 4,699 | 3,563 | 2,924 | 3,039 | 3,756 |
| 2014 | 3,126 | 2,511 | 1,346 | 1,891 | 2,142 | 2,000 | 1,349 | 1,498 | 1,248 | 1,315 | 1,025 | 1,358 |
| 2015 | 1,322 | 1,582 | 1,475 | 1,509 | 1,485 | 1,582 | 1,491 | 2,432 | 1,510 | 2,486 | 1,803 | 1,306 |
| 2016 | 959 | 839 | 924 | 1,343 | 1,649 | 2,258 | 1,638 | 1,867 | 2,237 | 1,563 | 1,422 | 1,176 |
| 2017 | 1,084 | 1,042 | 1,678 | 1,164 | 1,773 | 1,426 | 1,325 | 1,382 | 866 | 1,401 | 1,235 | 921 |
| 2018 | 956 | 707 | 977 | 835 | 1,200 | 1,683 | 1,822 | 1,417 | 1,788 | 956 | 1,181 | 668 |
| 2019 | 620 | 614 | 955 | 1,230 | 1,950 | 2,009 | 1,974 | 2,122 | 1,259 | 1,320 | 935 | 917 |
| 2020 | 940 | 988 | 1,046 | 788 | 1,109 | 1,213 | 1,579 | 1,364 | 1,067 | 861 | 813 | 706 |
| 2021 | 701 | 1,260 | 1,801 | 2,767 | 2,108 | 1,486 | 1,774 | 1,647 | 877 | 974 | 1,160 | 815 |
| 2022 | 881 | 668 | 646 | 956 | 861 | 3,073 | 3,537 | 1,884 | 2,280 | 2,229 | 936 | 714 |
| 2023 | 806 | 708 | 922 | 996 | 2,419 | 1,759 | 1,778 | 846 | 721 | 577 | 1,110 | 652 |
| 2024 | 513 | 428 | 817 | 1,608 | 1,257 | 1,845 | ||||||
| - = No Data Reported; -- = Not Applicable; NA = Not Available; W = Withheld to avoid disclosure of individual company data. |
| Release Date: 8/30/2024 |
| Next Release Date: 9/30/2024 |