|
Download Data (XLS File) |
|
||||||||
|
||||||||
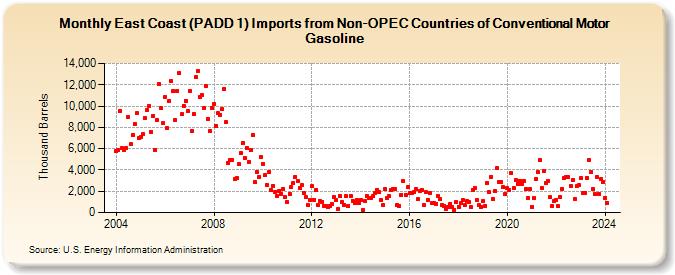
| East Coast (PADD 1) Imports from Non-OPEC Countries of Conventional Motor Gasoline (Thousand Barrels) | ||||||||
| Year | Jan | Feb | Mar | Apr | May | Jun | Jul | Aug | Sep | Oct | Nov | Dec |
|---|---|---|---|---|---|---|---|---|---|---|---|---|
| 2004 | 5,778 | 5,892 | 9,572 | 6,049 | 5,895 | 6,053 | 9,000 | 6,403 | 7,265 | 8,333 | 9,326 | 6,986 |
| 2005 | 7,122 | 7,332 | 8,926 | 9,654 | 10,024 | 7,608 | 9,082 | 5,910 | 8,688 | 12,066 | 9,810 | 8,371 |
| 2006 | 10,849 | 7,931 | 10,523 | 12,365 | 11,408 | 8,727 | 11,428 | 13,112 | 9,216 | 10,040 | 10,518 | 9,529 |
| 2007 | 11,445 | 7,626 | 9,259 | 12,684 | 13,280 | 10,881 | 11,037 | 9,825 | 11,895 | 8,795 | 7,661 | 9,823 |
| 2008 | 10,227 | 8,140 | 9,322 | 9,191 | 9,732 | 11,611 | 8,499 | 4,638 | 4,912 | 4,980 | 3,123 | 3,258 |
| 2009 | 4,541 | 5,582 | 6,527 | 5,138 | 6,077 | 4,787 | 5,845 | 7,266 | 2,848 | 3,847 | 3,386 | 5,203 |
| 2010 | 4,563 | 3,502 | 2,631 | 3,791 | 2,079 | 2,525 | 1,976 | 1,572 | 2,050 | 1,782 | 2,226 | 1,445 |
| 2011 | 981 | 1,780 | 2,391 | 2,770 | 3,350 | 2,953 | 2,336 | 2,562 | 1,796 | 1,424 | 723 | 1,208 |
| 2012 | 2,448 | 1,206 | 2,141 | 672 | 1,109 | 1,036 | 660 | 657 | 481 | 654 | 767 | 1,437 |
| 2013 | 1,158 | 380 | 1,565 | 982 | 746 | 1,531 | 624 | 1,601 | 1,109 | 895 | 1,187 | 888 |
| 2014 | 1,210 | 229 | 1,066 | 1,562 | 1,371 | 1,401 | 1,516 | 1,879 | 2,125 | 1,940 | 1,150 | 692 |
| 2015 | 2,198 | 1,402 | 1,511 | 2,129 | 2,218 | 2,174 | 753 | 632 | 1,633 | 2,940 | 1,674 | 2,365 |
| 2016 | 1,821 | 1,870 | 1,901 | 2,208 | 1,236 | 2,057 | 2,141 | 703 | 1,884 | 1,196 | 1,862 | 868 |
| 2017 | 925 | 812 | 1,549 | 1,244 | 709 | 610 | 316 | 564 | 829 | 519 | 268 | 973 |
| 2018 | 529 | 878 | 1,180 | 726 | 1,098 | 994 | 513 | 2,162 | 2,346 | 1,157 | 675 | 563 |
| 2019 | 1,039 | 619 | 2,821 | 1,946 | 3,378 | 1,231 | 1,989 | 4,178 | 2,863 | 2,875 | 2,363 | 1,730 |
| 2020 | 2,263 | 2,099 | 3,727 | 2,270 | 3,045 | 2,690 | 2,989 | 2,651 | 2,996 | 2,214 | 1,361 | 2,216 |
| 2021 | 558 | 1,349 | 3,125 | 3,845 | 4,929 | 2,277 | 3,906 | 2,819 | 2,962 | 1,431 | 619 | 1,060 |
| 2022 | 1,218 | 581 | 1,467 | 2,237 | 3,274 | 3,328 | 3,336 | 2,500 | 3,085 | 1,278 | 2,453 | 2,556 |
| 2023 | 3,220 | 1,790 | 1,883 | 3,287 | 4,934 | 3,790 | 2,191 | 1,726 | 3,324 | 1,784 | 3,122 | 2,883 |
| 2024 | 1,396 | |||||||||||
| - = No Data Reported; -- = Not Applicable; NA = Not Available; W = Withheld to avoid disclosure of individual company data. |
| Release Date: 3/29/2024 |
| Next Release Date: 4/30/2024 |