|
Download Data (XLS File) |
|
||||||||
|
||||||||
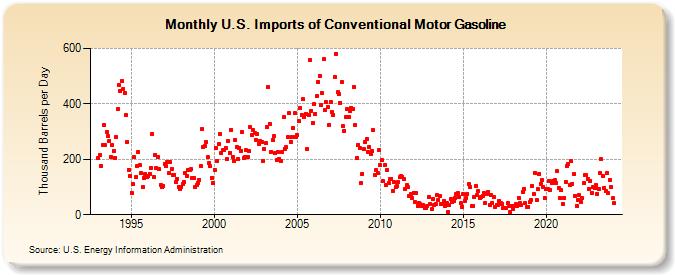
| U.S. Imports of Conventional Motor Gasoline (Thousand Barrels per Day) | ||||||||
| Year | Jan | Feb | Mar | Apr | May | Jun | Jul | Aug | Sep | Oct | Nov | Dec |
|---|---|---|---|---|---|---|---|---|---|---|---|---|
| 1993 | 204 | 216 | 177 | 253 | 323 | 251 | 300 | 283 | 267 | 210 | 252 | 231 |
| 1994 | 206 | 281 | 382 | 467 | 446 | 483 | 454 | 440 | 359 | 263 | 163 | 140 |
| 1995 | 80 | 111 | 207 | 135 | 174 | 227 | 178 | 149 | 99 | 133 | 146 | 136 |
| 1996 | 138 | 148 | 170 | 292 | 137 | 217 | 168 | 210 | 164 | 108 | 99 | 104 |
| 1997 | 184 | 174 | 189 | 151 | 189 | 165 | 143 | 144 | 118 | 130 | 101 | 93 |
| 1998 | 99 | 112 | 119 | 152 | 140 | 161 | 160 | 164 | 132 | 134 | 99 | 108 |
| 1999 | 113 | 126 | 174 | 310 | 246 | 249 | 263 | 207 | 186 | 174 | 134 | 113 |
| 2000 | 163 | 241 | 193 | 254 | 292 | 221 | 232 | 235 | 241 | 200 | 266 | 224 |
| 2001 | 307 | 210 | 195 | 271 | 244 | 201 | 242 | 231 | 299 | 204 | 207 | 232 |
| 2002 | 207 | 230 | 316 | 287 | 304 | 295 | 269 | 292 | 256 | 266 | 264 | 195 |
| 2003 | 237 | 257 | 317 | 460 | 327 | 228 | 269 | 283 | 222 | 198 | 226 | 202 |
| 2004 | 195 | 226 | 351 | 238 | 243 | 279 | 366 | 264 | 282 | 313 | 366 | 282 |
| 2005 | 287 | 337 | 384 | 361 | 416 | 354 | 365 | 237 | 360 | 558 | 375 | 331 |
| 2006 | 398 | 365 | 427 | 480 | 502 | 397 | 439 | 560 | 376 | 405 | 388 | 324 |
| 2007 | 408 | 372 | 361 | 498 | 581 | 441 | 434 | 404 | 478 | 319 | 303 | 351 |
| 2008 | 381 | 354 | 374 | 386 | 383 | 461 | 323 | 205 | 253 | 239 | 115 | 148 |
| 2009 | 236 | 263 | 274 | 227 | 244 | 218 | 230 | 304 | 142 | 161 | 149 | 232 |
| 2010 | 179 | 196 | 120 | 178 | 107 | 163 | 114 | 129 | 130 | 86 | 117 | 99 |
| 2011 | 102 | 119 | 135 | 138 | 137 | 130 | 92 | 106 | 99 | 66 | 74 | 60 |
| 2012 | 80 | 46 | 79 | 33 | 43 | 37 | 32 | 34 | 23 | 26 | 32 | 64 |
| 2013 | 40 | 19 | 56 | 35 | 38 | 70 | 53 | 68 | 40 | 38 | 49 | 33 |
| 2014 | 42 | 11 | 36 | 57 | 47 | 51 | 60 | 73 | 77 | 64 | 41 | 29 |
| 2015 | 74 | 51 | 61 | 75 | 109 | 100 | 33 | 33 | 63 | 103 | 70 | 84 |
| 2016 | 60 | 65 | 66 | 78 | 44 | 76 | 82 | 34 | 71 | 44 | 63 | 29 |
| 2017 | 35 | 36 | 51 | 42 | 37 | 23 | 23 | 24 | 41 | 33 | 10 | 32 |
| 2018 | 19 | 33 | 38 | 33 | 62 | 42 | 35 | 82 | 94 | 42 | 29 | 29 |
| 2019 | 45 | 52 | 103 | 76 | 151 | 53 | 91 | 148 | 111 | 124 | 100 | 62 |
| 2020 | 91 | 91 | 121 | 90 | 114 | 120 | 124 | 115 | 156 | 98 | 62 | 88 |
| 2021 | 40 | 62 | 119 | 175 | 183 | 107 | 192 | 111 | 147 | 69 | 32 | 54 |
| 2022 | 70 | 47 | 60 | 113 | 144 | 142 | 130 | 94 | 121 | 79 | 99 | 98 |
| 2023 | 108 | 76 | 94 | 151 | 200 | 140 | 97 | 84 | 151 | 78 | 127 | 101 |
| 2024 | 59 | 41 | ||||||||||
| - = No Data Reported; -- = Not Applicable; NA = Not Available; W = Withheld to avoid disclosure of individual company data. |
| Release Date: 4/30/2024 |
| Next Release Date: 5/31/2024 |