|
Download Data (XLS File) |
|
||||||||
|
||||||||
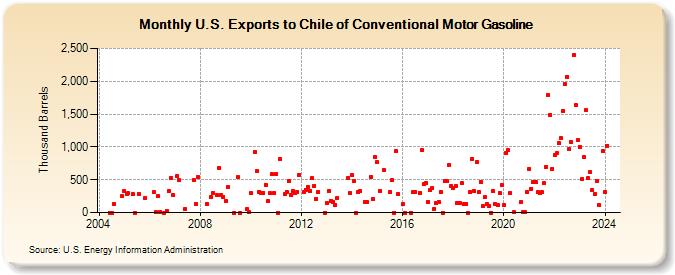
| U.S. Exports to Chile of Conventional Motor Gasoline (Thousand Barrels) | ||||||||
| Year | Jan | Feb | Mar | Apr | May | Jun | Jul | Aug | Sep | Oct | Nov | Dec |
|---|---|---|---|---|---|---|---|---|---|---|---|---|
| 2004 | 0 | 0 | 135 | 252 | ||||||||
| 2005 | 330 | 280 | 297 | 282 | 0 | 279 | 221 | |||||
| 2006 | 312 | 1 | 250 | 15 | 0 | 31 | 328 | 528 | 274 | |||
| 2007 | 551 | 492 | 53 | 495 | 123 | 543 | ||||||
| 2008 | 133 | 238 | 301 | 267 | 682 | 263 | 239 | |||||
| 2009 | 179 | 395 | 0 | 538 | 0 | 54 | 1 | |||||
| 2010 | 296 | 928 | 632 | 320 | 295 | 303 | 424 | 175 | 297 | 584 | 292 | |
| 2011 | 590 | 0 | 813 | 281 | 316 | 476 | 272 | 324 | 301 | 310 | 578 | |
| 2012 | 313 | 350 | 395 | 328 | 521 | 410 | 212 | 315 | 0 | |||
| 2013 | 150 | 331 | 179 | 164 | 118 | 219 | 531 | 299 | ||||
| 2014 | 567 | 487 | 0 | 313 | 322 | 164 | 164 | 546 | 203 | 840 | ||
| 2015 | 764 | 328 | 651 | 314 | 489 | 0 | 932 | 280 | ||||
| 2016 | 124 | 0 | 0 | 310 | 316 | 302 | 960 | 428 | 457 | |||
| 2017 | 157 | 347 | 374 | 57 | 143 | 158 | 316 | 0 | 473 | 474 | 723 | 408 |
| 2018 | 371 | 404 | 143 | 141 | 446 | 130 | 137 | 0 | 315 | 823 | 321 | 768 |
| 2019 | 306 | 467 | 99 | 235 | 124 | 101 | 0 | 323 | 130 | 114 | 300 | 424 |
| 2020 | 113 | 911 | 953 | 300 | 1 | 158 | 1 | 1 | 308 | |||
| 2021 | 669 | 364 | 472 | 459 | 308 | 303 | 306 | 444 | 698 | 1,789 | 1,492 | 668 |
| 2022 | 873 | 900 | 1,056 | 1,129 | 1,554 | 1,957 | 2,069 | 967 | 1,068 | 2,398 | 1,634 | 1,100 |
| 2023 | 1,002 | 514 | 845 | 1,556 | 520 | 612 | 340 | 278 | 486 | 109 | 930 | |
| 2024 | 315 | |||||||||||
| - = No Data Reported; -- = Not Applicable; NA = Not Available; W = Withheld to avoid disclosure of individual company data. |
| Release Date: 3/29/2024 |
| Next Release Date: 4/30/2024 |