|
Download Data (XLS File) |
|
||||||||
|
||||||||
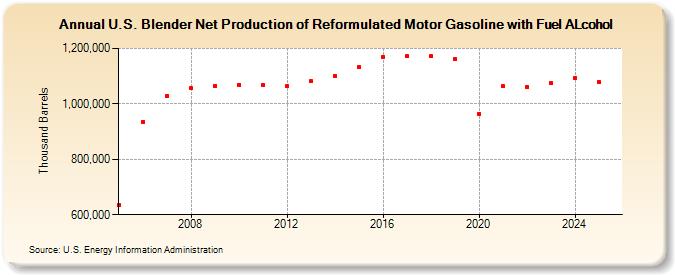
| U.S. Blender Net Production of Reformulated Motor Gasoline with Fuel ALcohol (Thousand Barrels) | ||||||||
| Decade | Year-0 | Year-1 | Year-2 | Year-3 | Year-4 | Year-5 | Year-6 | Year-7 | Year-8 | Year-9 |
|---|---|---|---|---|---|---|---|---|---|---|
| 2000's | 633,675 | 935,824 | 1,029,359 | 1,055,358 | 1,065,792 | |||||
| 2010's | 1,069,661 | 1,066,648 | 1,063,540 | 1,081,451 | 1,099,933 | 1,131,196 | 1,169,866 | 1,171,432 | 1,171,218 | 1,160,135 |
| 2020's | 964,908 | 1,062,545 | 1,061,382 | 1,074,574 |
| - = No Data Reported; -- = Not Applicable; NA = Not Available; W = Withheld to avoid disclosure of individual company data. |
| Release Date: 8/30/2024 |
| Next Release Date: 8/29/2025 |