|
Download Data (XLS File) |
|
||||||||
|
||||||||
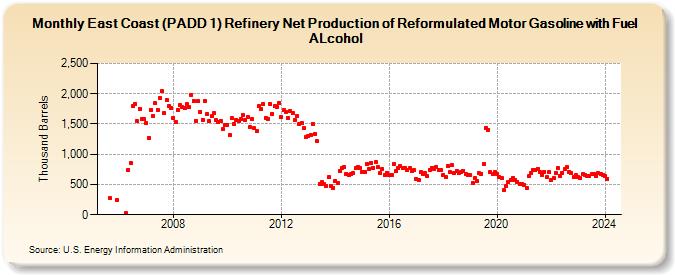
| East Coast (PADD 1) Refinery Net Production of Reformulated Motor Gasoline with Fuel ALcohol (Thousand Barrels) | ||||||||
| Year | Jan | Feb | Mar | Apr | May | Jun | Jul | Aug | Sep | Oct | Nov | Dec |
|---|---|---|---|---|---|---|---|---|---|---|---|---|
| 2005 | 271 | 241 | ||||||||||
| 2006 | 25 | 745 | 855 | 1,794 | 1,835 | 1,545 | 1,750 | 1,580 | 1,579 | |||
| 2007 | 1,512 | 1,266 | 1,738 | 1,636 | 1,842 | 1,739 | 1,932 | 2,038 | 1,674 | 1,897 | 1,800 | 1,758 |
| 2008 | 1,600 | 1,534 | 1,735 | 1,807 | 1,783 | 1,757 | 1,824 | 1,773 | 1,986 | 1,872 | 1,557 | 1,876 |
| 2009 | 1,699 | 1,573 | 1,882 | 1,658 | 1,543 | 1,624 | 1,677 | 1,561 | 1,540 | 1,556 | 1,411 | 1,489 |
| 2010 | 1,489 | 1,315 | 1,596 | 1,502 | 1,568 | 1,551 | 1,576 | 1,645 | 1,572 | 1,609 | 1,452 | 1,581 |
| 2011 | 1,428 | 1,383 | 1,790 | 1,748 | 1,827 | 1,607 | 1,586 | 1,829 | 1,670 | 1,795 | 1,784 | 1,843 |
| 2012 | 1,614 | 1,726 | 1,704 | 1,595 | 1,717 | 1,677 | 1,566 | 1,631 | 1,507 | 1,513 | 1,426 | 1,282 |
| 2013 | 1,299 | 1,325 | 1,506 | 1,331 | 1,216 | 507 | 537 | 501 | 477 | 621 | 475 | 440 |
| 2014 | 555 | 527 | 724 | 780 | 785 | 681 | 652 | 675 | 688 | 773 | 786 | 779 |
| 2015 | 714 | 705 | 839 | 752 | 856 | 780 | 871 | 784 | 683 | 756 | 656 | 694 |
| 2016 | 659 | 652 | 834 | 716 | 768 | 805 | 777 | 777 | 744 | 768 | 729 | 735 |
| 2017 | 593 | 566 | 706 | 669 | 684 | 634 | 745 | 780 | 749 | 787 | 738 | 739 |
| 2018 | 663 | 619 | 807 | 702 | 815 | 689 | 726 | 688 | 702 | 730 | 672 | 654 |
| 2019 | 655 | 526 | 599 | 550 | 684 | 680 | 831 | 1,439 | 1,407 | 709 | 676 | 707 |
| 2020 | 678 | 627 | 600 | 403 | 469 | 536 | 577 | 608 | 578 | 546 | 501 | 515 |
| 2021 | 497 | 448 | 634 | 687 | 746 | 735 | 762 | 708 | 652 | 712 | 617 | 704 |
| 2022 | 572 | 605 | 694 | 769 | 635 | 697 | 754 | 786 | 713 | 684 | 621 | 652 |
| 2023 | 618 | 609 | 669 | 664 | 645 | 647 | 677 | 678 | 641 | 687 | 673 | 655 |
| 2024 | 633 | 592 | ||||||||||
| - = No Data Reported; -- = Not Applicable; NA = Not Available; W = Withheld to avoid disclosure of individual company data. |
| Release Date: 4/30/2024 |
| Next Release Date: 5/31/2024 |