|
Download Data (XLS File) |
|
||||||||
|
||||||||
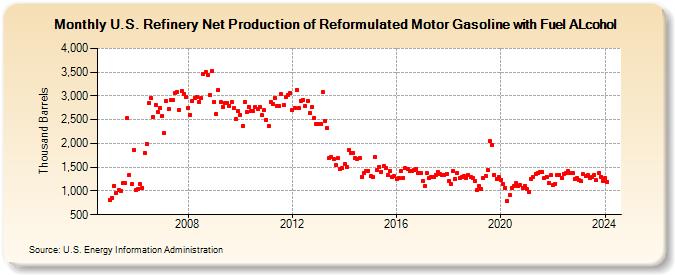
| U.S. Refinery Net Production of Reformulated Motor Gasoline with Fuel ALcohol (Thousand Barrels) | ||||||||
| Year | Jan | Feb | Mar | Apr | May | Jun | Jul | Aug | Sep | Oct | Nov | Dec |
|---|---|---|---|---|---|---|---|---|---|---|---|---|
| 2005 | 807 | 856 | 1,113 | 963 | 1,021 | 1,009 | 1,158 | 1,166 | 2,534 | 1,336 | 1,138 | 1,872 |
| 2006 | 1,023 | 1,042 | 1,140 | 1,070 | 1,803 | 1,991 | 2,847 | 2,956 | 2,563 | 2,817 | 2,661 | 2,752 |
| 2007 | 2,584 | 2,214 | 2,892 | 2,726 | 2,917 | 2,904 | 3,064 | 3,088 | 2,713 | 3,108 | 3,043 | 2,986 |
| 2008 | 2,751 | 2,605 | 2,892 | 2,952 | 2,967 | 2,875 | 2,955 | 3,459 | 3,504 | 3,447 | 3,015 | 3,524 |
| 2009 | 2,882 | 2,621 | 3,127 | 2,862 | 2,767 | 2,841 | 2,859 | 2,798 | 2,863 | 2,747 | 2,518 | 2,678 |
| 2010 | 2,600 | 2,370 | 2,875 | 2,654 | 2,775 | 2,682 | 2,673 | 2,766 | 2,731 | 2,770 | 2,593 | 2,697 |
| 2011 | 2,501 | 2,364 | 2,879 | 2,826 | 2,959 | 2,798 | 2,786 | 3,033 | 2,811 | 2,968 | 3,029 | 3,071 |
| 2012 | 2,700 | 2,742 | 3,132 | 2,744 | 2,900 | 2,918 | 2,783 | 2,903 | 2,642 | 2,758 | 2,544 | 2,403 |
| 2013 | 2,419 | 2,399 | 3,076 | 2,463 | 2,331 | 1,683 | 1,717 | 1,682 | 1,536 | 1,686 | 1,471 | 1,480 |
| 2014 | 1,570 | 1,501 | 1,870 | 1,792 | 1,804 | 1,694 | 1,674 | 1,700 | 1,299 | 1,384 | 1,417 | 1,428 |
| 2015 | 1,309 | 1,291 | 1,705 | 1,438 | 1,512 | 1,405 | 1,527 | 1,490 | 1,339 | 1,410 | 1,298 | 1,311 |
| 2016 | 1,253 | 1,271 | 1,425 | 1,282 | 1,475 | 1,463 | 1,412 | 1,417 | 1,450 | 1,454 | 1,385 | 1,379 |
| 2017 | 1,209 | 1,100 | 1,371 | 1,265 | 1,285 | 1,291 | 1,341 | 1,408 | 1,351 | 1,342 | 1,343 | 1,366 |
| 2018 | 1,218 | 1,143 | 1,420 | 1,254 | 1,385 | 1,269 | 1,287 | 1,323 | 1,267 | 1,343 | 1,285 | 1,265 |
| 2019 | 1,217 | 1,028 | 1,103 | 1,033 | 1,279 | 1,323 | 1,434 | 2,041 | 1,974 | 1,344 | 1,255 | 1,286 |
| 2020 | 1,232 | 1,148 | 1,071 | 789 | 917 | 1,068 | 1,108 | 1,169 | 1,099 | 1,119 | 1,052 | 1,111 |
| 2021 | 1,037 | 978 | 1,255 | 1,290 | 1,357 | 1,376 | 1,393 | 1,403 | 1,271 | 1,303 | 1,170 | 1,328 |
| 2022 | 1,127 | 1,152 | 1,339 | 1,346 | 1,270 | 1,349 | 1,372 | 1,417 | 1,379 | 1,382 | 1,247 | 1,276 |
| 2023 | 1,233 | 1,204 | 1,348 | 1,318 | 1,328 | 1,275 | 1,299 | 1,340 | 1,221 | 1,376 | 1,304 | 1,216 |
| 2024 | 1,269 | |||||||||||
| - = No Data Reported; -- = Not Applicable; NA = Not Available; W = Withheld to avoid disclosure of individual company data. |
| Release Date: 3/29/2024 |
| Next Release Date: 4/30/2024 |