|
Download Data (XLS File) |
|
||||||||
|
||||||||
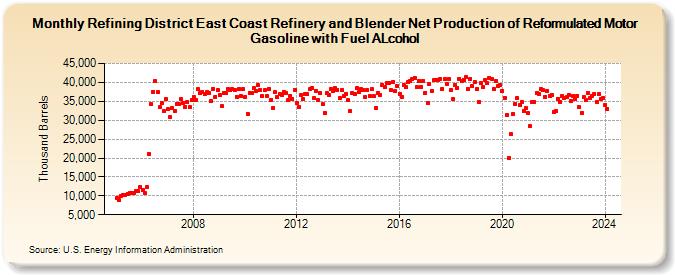
| Refining District East Coast Refinery and Blender Net Production of Reformulated Motor Gasoline with Fuel ALcohol (Thousand Barrels) | ||||||||
| Year | Jan | Feb | Mar | Apr | May | Jun | Jul | Aug | Sep | Oct | Nov | Dec |
|---|---|---|---|---|---|---|---|---|---|---|---|---|
| 2005 | 9,435 | 8,766 | 10,042 | 10,318 | 10,186 | 10,610 | 10,718 | 10,636 | 10,741 | 11,160 | 11,240 | 12,302 |
| 2006 | 11,416 | 10,612 | 12,317 | 21,040 | 34,152 | 37,541 | 40,341 | 37,388 | 33,413 | 34,581 | 32,430 | 35,523 |
| 2007 | 32,858 | 30,786 | 33,196 | 32,520 | 34,306 | 34,195 | 35,616 | 34,597 | 33,494 | 34,682 | 33,481 | 35,336 |
| 2008 | 36,160 | 35,390 | 38,154 | 37,138 | 37,425 | 36,854 | 37,343 | 37,119 | 35,197 | 38,257 | 36,225 | 37,964 |
| 2009 | 36,608 | 33,649 | 37,168 | 37,235 | 38,127 | 37,925 | 38,212 | 38,091 | 36,244 | 38,174 | 36,485 | 38,222 |
| 2010 | 36,237 | 31,761 | 37,309 | 37,151 | 38,495 | 37,659 | 39,244 | 38,006 | 36,321 | 37,873 | 36,349 | 38,304 |
| 2011 | 35,451 | 33,236 | 37,356 | 36,052 | 36,957 | 36,743 | 37,577 | 37,151 | 35,243 | 36,496 | 35,641 | 37,999 |
| 2012 | 34,528 | 33,509 | 36,541 | 35,504 | 37,056 | 36,814 | 38,154 | 38,488 | 35,804 | 37,725 | 35,322 | 37,132 |
| 2013 | 34,184 | 31,959 | 37,174 | 36,755 | 38,276 | 37,834 | 38,412 | 38,021 | 35,773 | 38,024 | 36,403 | 37,000 |
| 2014 | 35,213 | 32,331 | 37,131 | 36,903 | 38,491 | 37,541 | 38,243 | 38,007 | 36,104 | 37,987 | 36,412 | 38,192 |
| 2015 | 36,274 | 33,244 | 37,273 | 36,685 | 39,369 | 38,791 | 39,844 | 39,874 | 37,985 | 40,104 | 37,623 | 38,921 |
| 2016 | 36,910 | 36,241 | 39,353 | 38,702 | 40,102 | 40,258 | 40,898 | 41,134 | 38,743 | 40,389 | 38,867 | 40,496 |
| 2017 | 37,296 | 34,634 | 39,463 | 37,822 | 40,500 | 40,663 | 40,535 | 40,957 | 38,335 | 40,862 | 39,581 | 40,978 |
| 2018 | 37,974 | 35,550 | 39,428 | 38,633 | 40,916 | 40,261 | 40,709 | 41,322 | 38,252 | 40,934 | 38,988 | 40,152 |
| 2019 | 38,308 | 34,902 | 39,824 | 38,710 | 40,632 | 39,825 | 41,157 | 41,002 | 38,315 | 40,318 | 39,122 | 39,281 |
| 2020 | 37,793 | 35,966 | 31,451 | 20,082 | 26,340 | 31,621 | 34,371 | 35,858 | 33,991 | 34,860 | 32,470 | 33,104 |
| 2021 | 31,862 | 28,404 | 34,797 | 34,746 | 37,134 | 36,982 | 38,213 | 37,978 | 36,233 | 37,792 | 36,275 | 36,748 |
| 2022 | 32,159 | 32,386 | 35,609 | 34,848 | 36,450 | 35,907 | 36,065 | 36,766 | 35,185 | 36,358 | 35,681 | 36,514 |
| 2023 | 33,384 | 32,021 | 36,079 | 35,223 | 37,255 | 35,769 | 36,487 | 36,975 | 34,943 | 36,895 | 35,585 | 35,755 |
| 2024 | 34,097 | |||||||||||
| - = No Data Reported; -- = Not Applicable; NA = Not Available; W = Withheld to avoid disclosure of individual company data. |
| Release Date: 3/29/2024 |
| Next Release Date: 4/30/2024 |