|
Download Data (XLS File) |
|
||||||||
|
||||||||
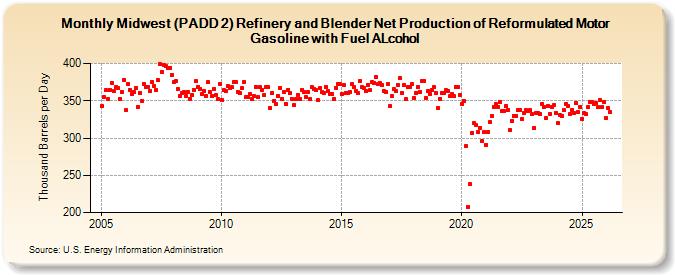
| Midwest (PADD 2) Refinery and Blender Net Production of Reformulated Motor Gasoline with Fuel ALcohol (Thousand Barrels per Day) | ||||||||
| Year | Jan | Feb | Mar | Apr | May | Jun | Jul | Aug | Sep | Oct | Nov | Dec |
|---|---|---|---|---|---|---|---|---|---|---|---|---|
| 2005 | 343 | 355 | 364 | 352 | 365 | 374 | 363 | 368 | 367 | 353 | 362 | 378 |
| 2006 | 337 | 372 | 365 | 359 | 362 | 367 | 342 | 361 | 350 | 373 | 368 | 369 |
| 2007 | 363 | 375 | 370 | 364 | 378 | 399 | 389 | 398 | 396 | 394 | 394 | 385 |
| 2008 | 375 | 376 | 366 | 357 | 361 | 362 | 357 | 362 | 353 | 358 | 365 | 376 |
| 2009 | 369 | 366 | 359 | 363 | 357 | 375 | 362 | 356 | 366 | 358 | 352 | 372 |
| 2010 | 351 | 364 | 363 | 370 | 367 | 368 | 375 | 375 | 362 | 360 | 367 | 375 |
| 2011 | 355 | 355 | 359 | 352 | 356 | 369 | 355 | 368 | 365 | 358 | 368 | 369 |
| 2012 | 340 | 360 | 350 | 346 | 357 | 367 | 353 | 362 | 346 | 365 | 360 | 353 |
| 2013 | 344 | 352 | 358 | 353 | 365 | 362 | 355 | 362 | 352 | 368 | 366 | 364 |
| 2014 | 351 | 367 | 362 | 360 | 369 | 363 | 359 | 359 | 353 | 367 | 373 | 372 |
| 2015 | 359 | 371 | 361 | 360 | 362 | 372 | 369 | 363 | 360 | 377 | 368 | 367 |
| 2016 | 363 | 371 | 364 | 375 | 374 | 382 | 372 | 374 | 371 | 363 | 362 | 372 |
| 2017 | 343 | 356 | 366 | 363 | 371 | 380 | 361 | 371 | 352 | 368 | 369 | 372 |
| 2018 | 354 | 361 | 369 | 362 | 376 | 377 | 354 | 363 | 359 | 365 | 368 | 361 |
| 2019 | 340 | 353 | 361 | 361 | 364 | 363 | 356 | 359 | 356 | 369 | 369 | 358 |
| 2020 | 346 | 350 | 289 | 208 | 238 | 307 | 320 | 317 | 308 | 314 | 296 | 308 |
| 2021 | 291 | 308 | 321 | 329 | 342 | 346 | 342 | 348 | 336 | 336 | 343 | 338 |
| 2022 | 311 | 323 | 330 | 330 | 337 | 337 | 326 | 334 | 337 | 336 | 337 | 332 |
| 2023 | 314 | 333 | 334 | 332 | 346 | 342 | 327 | 342 | 332 | 341 | 344 | 334 |
| 2024 | 320 | |||||||||||
| - = No Data Reported; -- = Not Applicable; NA = Not Available; W = Withheld to avoid disclosure of individual company data. |
| Release Date: 3/29/2024 |
| Next Release Date: 4/30/2024 |