|
Download Data (XLS File) |
|
||||||||
|
||||||||
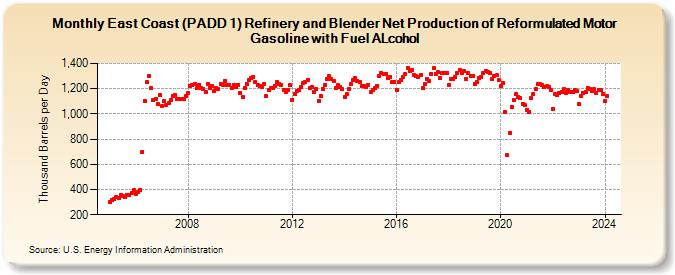
| East Coast (PADD 1) Refinery and Blender Net Production of Reformulated Motor Gasoline with Fuel ALcohol (Thousand Barrels per Day) | ||||||||
| Year | Jan | Feb | Mar | Apr | May | Jun | Jul | Aug | Sep | Oct | Nov | Dec |
|---|---|---|---|---|---|---|---|---|---|---|---|---|
| 2005 | 304 | 313 | 324 | 344 | 329 | 354 | 346 | 343 | 358 | 360 | 375 | 397 |
| 2006 | 368 | 379 | 397 | 701 | 1,102 | 1,251 | 1,301 | 1,206 | 1,114 | 1,116 | 1,081 | 1,146 |
| 2007 | 1,060 | 1,100 | 1,071 | 1,084 | 1,107 | 1,140 | 1,149 | 1,116 | 1,116 | 1,119 | 1,116 | 1,140 |
| 2008 | 1,166 | 1,220 | 1,231 | 1,238 | 1,207 | 1,228 | 1,205 | 1,197 | 1,173 | 1,234 | 1,208 | 1,225 |
| 2009 | 1,181 | 1,202 | 1,199 | 1,241 | 1,230 | 1,264 | 1,233 | 1,229 | 1,208 | 1,231 | 1,216 | 1,233 |
| 2010 | 1,169 | 1,134 | 1,204 | 1,239 | 1,270 | 1,284 | 1,294 | 1,255 | 1,229 | 1,222 | 1,212 | 1,236 |
| 2011 | 1,144 | 1,187 | 1,205 | 1,202 | 1,220 | 1,254 | 1,241 | 1,228 | 1,192 | 1,177 | 1,188 | 1,226 |
| 2012 | 1,114 | 1,155 | 1,179 | 1,188 | 1,217 | 1,248 | 1,252 | 1,267 | 1,206 | 1,217 | 1,177 | 1,198 |
| 2013 | 1,103 | 1,141 | 1,199 | 1,232 | 1,276 | 1,299 | 1,274 | 1,261 | 1,209 | 1,227 | 1,213 | 1,194 |
| 2014 | 1,136 | 1,155 | 1,198 | 1,236 | 1,270 | 1,282 | 1,262 | 1,255 | 1,219 | 1,225 | 1,214 | 1,232 |
| 2015 | 1,170 | 1,187 | 1,202 | 1,223 | 1,299 | 1,322 | 1,317 | 1,317 | 1,282 | 1,294 | 1,254 | 1,256 |
| 2016 | 1,191 | 1,250 | 1,269 | 1,294 | 1,315 | 1,364 | 1,340 | 1,349 | 1,309 | 1,303 | 1,296 | 1,306 |
| 2017 | 1,203 | 1,237 | 1,273 | 1,261 | 1,317 | 1,365 | 1,317 | 1,330 | 1,283 | 1,321 | 1,323 | 1,326 |
| 2018 | 1,229 | 1,273 | 1,275 | 1,291 | 1,328 | 1,350 | 1,324 | 1,341 | 1,280 | 1,323 | 1,303 | 1,299 |
| 2019 | 1,239 | 1,250 | 1,287 | 1,293 | 1,324 | 1,341 | 1,336 | 1,326 | 1,280 | 1,303 | 1,306 | 1,270 |
| 2020 | 1,221 | 1,242 | 1,017 | 670 | 850 | 1,055 | 1,110 | 1,157 | 1,133 | 1,125 | 1,082 | 1,068 |
| 2021 | 1,028 | 1,015 | 1,123 | 1,159 | 1,199 | 1,234 | 1,234 | 1,227 | 1,210 | 1,220 | 1,211 | 1,186 |
| 2022 | 1,038 | 1,158 | 1,150 | 1,163 | 1,177 | 1,199 | 1,165 | 1,188 | 1,174 | 1,175 | 1,191 | 1,180 |
| 2023 | 1,078 | 1,145 | 1,165 | 1,176 | 1,204 | 1,195 | 1,179 | 1,194 | 1,166 | 1,191 | 1,187 | 1,154 |
| 2024 | 1,101 | |||||||||||
| - = No Data Reported; -- = Not Applicable; NA = Not Available; W = Withheld to avoid disclosure of individual company data. |
| Release Date: 3/29/2024 |
| Next Release Date: 4/30/2024 |