|
Download Data (XLS File) |
|
||||||||
|
||||||||
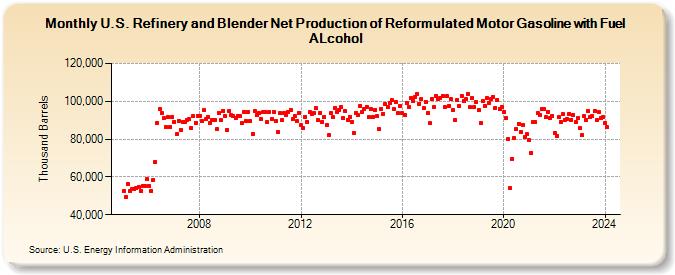
| U.S. Refinery and Blender Net Production of Reformulated Motor Gasoline with Fuel ALcohol (Thousand Barrels) | ||||||||
| Year | Jan | Feb | Mar | Apr | May | Jun | Jul | Aug | Sep | Oct | Nov | Dec |
|---|---|---|---|---|---|---|---|---|---|---|---|---|
| 2005 | 52,509 | 49,477 | 56,376 | 52,283 | 53,545 | 53,344 | 54,202 | 54,727 | 52,737 | 55,275 | 55,282 | 58,891 |
| 2006 | 55,265 | 52,756 | 58,589 | 68,138 | 88,702 | 95,819 | 93,905 | 90,998 | 86,380 | 91,629 | 86,589 | 91,719 |
| 2007 | 89,296 | 82,476 | 89,623 | 84,705 | 89,046 | 88,898 | 90,323 | 90,389 | 86,108 | 91,995 | 88,687 | 92,052 |
| 2008 | 92,386 | 89,579 | 95,197 | 90,568 | 91,894 | 88,519 | 89,873 | 90,293 | 85,081 | 94,005 | 89,847 | 95,062 |
| 2009 | 92,192 | 85,043 | 94,869 | 92,661 | 92,394 | 91,179 | 92,161 | 91,964 | 88,479 | 94,526 | 89,482 | 94,405 |
| 2010 | 89,524 | 82,638 | 94,783 | 92,832 | 93,893 | 90,673 | 94,188 | 94,474 | 89,130 | 94,506 | 90,801 | 94,405 |
| 2011 | 89,774 | 83,645 | 93,646 | 90,043 | 93,922 | 92,768 | 94,540 | 95,626 | 90,608 | 92,434 | 89,632 | 94,035 |
| 2012 | 87,284 | 85,683 | 91,768 | 89,171 | 94,297 | 93,094 | 94,044 | 96,506 | 90,132 | 93,986 | 89,164 | 91,580 |
| 2013 | 87,358 | 81,970 | 93,590 | 91,451 | 96,626 | 94,304 | 95,281 | 97,037 | 90,937 | 94,662 | 90,332 | 91,846 |
| 2014 | 89,271 | 83,247 | 93,999 | 92,514 | 97,643 | 94,288 | 96,152 | 97,200 | 91,642 | 95,925 | 91,782 | 95,403 |
| 2015 | 92,025 | 85,376 | 95,715 | 93,467 | 98,409 | 97,109 | 99,187 | 100,421 | 95,805 | 99,632 | 93,670 | 97,415 |
| 2016 | 93,749 | 92,571 | 98,984 | 97,135 | 101,493 | 100,348 | 102,456 | 103,762 | 98,781 | 100,953 | 96,419 | 99,881 |
| 2017 | 93,844 | 88,255 | 101,183 | 96,999 | 102,956 | 101,218 | 101,522 | 102,882 | 96,897 | 102,580 | 97,696 | 101,072 |
| 2018 | 95,378 | 90,131 | 100,569 | 97,423 | 103,042 | 100,161 | 100,991 | 103,842 | 96,843 | 101,677 | 97,120 | 99,500 |
| 2019 | 95,354 | 88,376 | 99,963 | 97,762 | 101,638 | 99,177 | 101,198 | 102,464 | 96,555 | 100,932 | 96,126 | 96,907 |
| 2020 | 94,279 | 90,934 | 79,842 | 53,919 | 69,704 | 80,421 | 85,299 | 88,190 | 83,952 | 87,719 | 81,013 | 82,519 |
| 2021 | 79,467 | 72,868 | 88,929 | 88,988 | 93,740 | 92,770 | 95,821 | 95,840 | 91,485 | 94,514 | 91,036 | 92,248 |
| 2022 | 83,250 | 81,892 | 91,455 | 89,170 | 93,363 | 90,299 | 90,829 | 93,519 | 90,244 | 92,874 | 89,111 | 91,032 |
| 2023 | 85,858 | 82,142 | 92,036 | 90,179 | 94,832 | 91,495 | 92,343 | 94,819 | 89,884 | 94,420 | 90,940 | 91,760 |
| 2024 | 88,425 | |||||||||||
| - = No Data Reported; -- = Not Applicable; NA = Not Available; W = Withheld to avoid disclosure of individual company data. |
| Release Date: 3/29/2024 |
| Next Release Date: 4/30/2024 |